
|
Numbers — Charts:
History:
Analyses:
| Tweet | | Contact | Follow @chrischantrill |
What is the Total US Government Spending?
In FY 2026, total US government spending, federal, state, and local, is “guesstimated” to be $13.57 trillion. Federal spending is budgeted at $7.42 trillion; state spending is “guesstimated” at $3.71 trillion; local spending is “guesstimated” at $3.63 trillion.
a usgovernmentspending.com briefing:

US Government Spending Estimates for FY 2026
In fiscal year 2026 the governments in the United States
are expected to spend about
44.5
percent of
Gross Domestic Product. Most of the money goes for health care, education, pensions, defense, and welfare
programs. Health care spending is split mainly between federal and state governments; education
spending occurs mainly at the local government level; pension spending is primarily the federal
government’s Social Security program and the states’ government employee pension programs.
Government Spending: Federal, State, Local
Governments in the US will spend $13.6 trillion in 2026.
In fiscal 2026 the federal government estimates spending will be $7.4 trillion, of which $1.2 trillion will be transferred to states and local governments. State spending for 2026 is "guesstimated" by usgovernmentspending.com at $3.7 trillion and local government spending is "guesstimated" by usgovernmentspending.com at $3.6 trillion.
Total spending at all levels of government in the United States is "guesstimated" by usgovernmentspending.com to be $13.6 trillion in 2026.
Government Spending: the Big Picture
The four big functions each cost over one trillion dollars a year. Or more.
Where does all the money go? It is really quite simple. Governments at all levels, federal, state, and local, spend about $2.2 trillion a year on pensions, including Social Security and government employee pensions. Governments spend about $2.9 trillion a year on health care, principally Medicare and Medicaid. Governments spend about $1.9 trillion a year on education at all levels, principally at the local government level. The federal government spends about $1.4 trillion a year on defense, including the Departments of Defense, State, and Veterans Affairs. Governments spend $0.9 trillion on welfare programs other than Medicaid. All other spending amounts to $3.8 trillion, including interest on the national debt. The grand total of all the spending is $13.6 trillion.
Pie Chart of Total US Government Spending
Although the four big government programs — pensions, health care, education, and defense — each cost about a trillion dollars a year they are distributed unequally between the levels of government.

Chart 2.04: Total Spending Details
Total government spending in the United States, including federal, state, and local governments, is expected to total $13.57 trillion in FY 2026. The total features five major functions. Of the total spending, health care takes a 22 percent share, pensions an 18 percent share, education a 13 percent share, defense a 12 percent share, welfare an 8 percent share. All other functions, including interest on the debt, take 26 percent of spending.
Pie Chart of Federal Government Spending

Chart 2.05: Federal Spending Details
Federal spending is budgeted at $7.42 trillion in FY 2026, and includes four major functions. Health care, principally Medicare and Medicaid, takes a 25 percent share; pensions, principally Social Security, take a 22 percent share; defense, including foreign policy, veterans, and foreign aid, is 19 percent of spending; welfare takes 11 percent of spending. All other spending, including interest on the national debt, takes 23 percent of federal spending.
Notice that education is not a major item in federal spending.
Pie Chart of State Government Spending
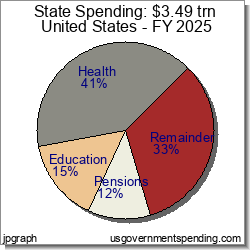
Chart 2.06: State Spending Details
State government spending, as "guesstimated" by usgovernmentspending.com, will total about $3.71 trillion in FY 2026, and features three major functions. Health care takes 43 percent of spending; education has an 17 percent share; state government pensions have a 15 percent share. All other spending takes a 26 percent share of state government spending.
Pie Chart of Local Government Spending
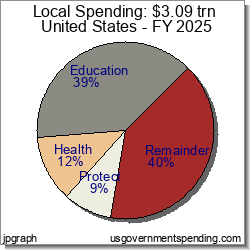
Chart 2.07: Local Spending Details
Local government spending, as "guesstimated" by usgovernmentspending.com, will total about $3.63 trillion in FY 2026, and features three major functions. Biggest program by far is education, K-12 schools, taking a full 37 percent of local spending; protection — police, fire and justice system — has a 10 percent share. health care has a 9 percent share; All other functions, at 44 percent of total, each take less than 7 percent of local government spending.

Suggested Video: Spending 101
Top Spending Requests:
Find DEFICIT stats and history.
Get WELFARE stats and history.
US BUDGET overview and pie chart.
Find NATIONAL DEBT today.
DOWNLOAD spending data or debt data.
See FEDERAL BUDGET breakdown and estimated vs. actual.
MILITARY SPENDING details, budget and history.
ENTITLEMENT SPENDING history.
See BAR CHARTS of spending, debt.
Check STATE spending: CA NY TX FL and compare.
See SPENDING ANALYSIS briefing.
See SPENDING HISTORY briefing.
Take a COURSE at Spending 101.
Make your own CUSTOM CHART.
Spending Data Sources
Spending data is from official government sources.
- Federal spending data since 1962 comes from the president’s budget.
- All other spending data comes from the US Census Bureau.
Gross Domestic Product data comes from US Bureau of Economic Analysis and measuringworth.com.
Detailed table of spending data sources here.
Medicare breakdown here; Medicaid breakdown here.
Federal spending data begins in 1792.
State and local spending data begins in 1820.
State and local spending data for individual states begins in 1957.
Gross Federal Debt
| Debt Now: | $37,889,756,572,760.44 | Debt 2/2020: | $23,409,959,150,243.63 |
Site Search
Spending 101
Take a course in government spending:
Spending |
Federal Debt |
Revenue
Defense |
Welfare |
Healthcare |
Education
Debt History |
Entitlements |
Deficits
State Spending |
State Taxes |
State Debt
It’s free!
Win Cash for Bugs
File a valid bug report and get a $5 Amazon Gift Certificate.
Get the Books
 Price: $0.99 Or download for free. |
 From usgovernment spending.com Price: $1.99 |
 Life after liberalism Price: $0.99 Or download for free. |
Blog
CBO Long Term Budget Outlook for 2025
On March 27, 2025 the Congressional Budget Office released its annual Long Term Budget Outlook for 2025, which projects federal spending and revenue out to 2055. As before, the data for the CBO study shows that federal health-care programs and interest costs will eat the budget, with federal spending exceeding 25 percent GDP by the 2040s while federal revenue stays a little over 19 percent GDP.
UsGovernmentspending.com has updated its chart of the CBO Long Term Budget Outlook here. You can download the data and also view CBO Long Term Budget Outlooks going back to 1999.
On November 22, 2025 usgovernmentspending.com updated FY2025 state revenue with quarterly tax data released by the US Ce ...
The US Bureau of Economic Analysis (BEA) released its Gross State Product (GSP) data for 2024 on March 29, 2025.Usgovernmen ...
> blog
Budget News
President’s FY 2025 Budget Release Scheduled for March 11
Although the FY 2024 appropriations process is not yet resolved
Biden to Release Budget March 9
will press McCarthy On Default Risk - Bloomberg
Biden to Release 2023 Budget Request on March 28
how the administration expects to spend money for priorities including aid to Ukraine and the continuing effort to fight the coronavirus pandemic, as well as legislative proposals such as increased funding for community policing programs, cancer research, and mental health education.
> archive
Spend Links
us numbers • us budget • custom chart • deficit/gdp • spend/gdp • debt/gdp • us gdp • us real gdp • state gdp • breakdown • federal • state • local • 2024 • 2025 • 2026 • california • texas
