
|
Numbers — Charts:
History:
Analyses:
| Tweet | | Contact | Follow @chrischantrill |
a usgovernmentspending.com briefing:

US Government Spending History from 1900
Nobody, in 1900, speculating on the future of government, could have imagined the astonishing growth and scope of government in the 20th century. Nor would they have imagined that, for many people, this gigantic government would seem the very essence of efficiency, compassion, and modernity. But the reason that government has got so big is not, as many claim, the weight of armaments and wars. Instead the money goes for health care, education, pensions, and welfare programs. You can see how it all happened in the United States in the charts below.
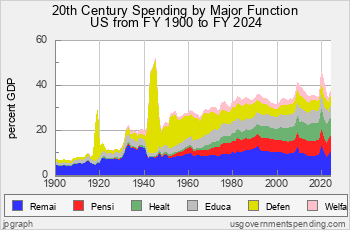
A Century of Government Spending
Government spending in the United States has steadily increased from seven percent of GDP in 1902 to almost 40 percent today.

Chart 2.21: 20th Century Government Spending
Government Spending started out at the beginning of the 20th century at 6.9 percent of Gross Domestic Product (GDP). As you can see from Chart 2.21, the federal share of that spending was modest. But spending got a big kick in World War I and ended up at about 12 percent of GDP in the 1920s.
Then came the Great Depression, in which President Roosevelt and the New Deal cranked up federal spending, and total government spending rose up to 20 percent of GDP. World War II really showed how the United States could commandeer its national resources for all out war. Government spending peaked at just under 52 percent of GDP in 1945.
 - Local direct spending
 - State direct spending
 - Federal direct spending
 - Transfer to state and local
President Clinton said, in 1995, that the era of big government was over. But he was wrong. The post World War II era has been a golden age of government spending, and it shows no sign of ending. Although spending dropped back to 21 percent of GDP immediately after WWII, it steadily climbed thereafter until it hit a peak of 35 percent of GDP in the bottom of the recession of 1980-82. Thereafter government spending chugged along in the mid 30s until the mortgage meltdown of 2008. In the aftermath of bank and auto bailouts, government spending surged to wartime levels at 41 percent of GDP but then moderated to about 36 percent of GDP. In the COVID crisis of 2020 spending surged to just undero 50 percent GDP.
Federal spending for FY2025 was 22.8 percent GDP. Estimated state spending for 2025 was 10.9 percent GDP. Estimate local spending for 2025 was 9.8 percent GDP.


Suggested Video: Spending 101
Top Spending Requests:
Find DEFICIT stats and history.
Get WELFARE stats and history.
US BUDGET overview and pie chart.
Find NATIONAL DEBT today.
DOWNLOAD spending data or debt data.
See FEDERAL BUDGET breakdown and estimated vs. actual.
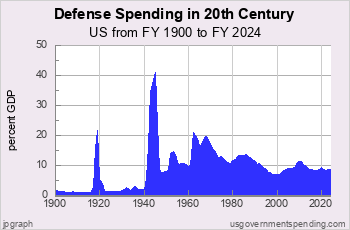
MILITARY SPENDING details, budget and history.
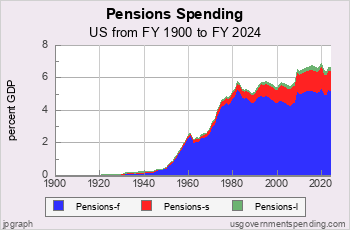
ENTITLEMENT SPENDING history.
See BAR CHARTS of spending, debt.
Check STATE spending: CA NY TX FL and compare.
See SPENDING ANALYSIS briefing.
See SPENDING HISTORY briefing.
Take a COURSE at Spending 101.
Make your own CUSTOM CHART.
Spending Data Sources
Spending data is from official government sources.
- Federal spending data since 1962 comes from the president’s budget.
- All other spending data comes from the US Census Bureau.
Gross Domestic Product data comes from US Bureau of Economic Analysis and measuringworth.com.
Detailed table of spending data sources here.
Medicare breakdown here; Medicaid breakdown here.
Federal spending data begins in 1792.
State and local spending data begins in 1820.
State and local spending data for individual states begins in 1957.
Gross Federal Debt
| Debt Now: | $39,713,964,053,447.11 | Debt 2/2020: | $23,409,959,150,243.63 |
Site Search
Spending 101
Take a course in government spending:
Spending |
Federal Debt |
Revenue
Defense |
Welfare |
Healthcare |
Education
Debt History |
Entitlements |
Deficits
State Spending |
State Taxes |
State Debt
It’s free!
Win Cash for Bugs
File a valid bug report and get a $5 Amazon Gift Certificate.
Get the Books
 Price: $0.99 Or download for free. |
 From usgovernment spending.com Price: $1.99 |
 Life after liberalism Price: $0.99 Or download for free. |
Blog
State and Local Finances for 2024 -- First Look
On July 2, 2026 we updated the state and local spending and revenue for FY 2024 using the new Census Bureau State and Local Government Finances "first look"summaries for FY 2024 released in April 2026. (See also Annual Survey of State and Local Government Finances). The release includes state and local spending for the United States as a whole. It does not include the 50 individual states and the District of Columbia.
State and local spending and revenue for FY2024 are now actual historical spending as reported by the Census Bureau.
We have updated the "guesstimated" state and local finances for FY2025-31 as indicated in our "guesstimate" blog entries.
Beginning in 2021, the Census Bureau stopped splitting "Public welfare" into three parts:
- Cash assistance payments
- Vendor payments
- Other public welfare
On June 16, 2026, the Center for Medicare Services released its annual ...
On February 25, 2026 the Congressional Budget Office released its annual Long Term Budget Outlook for 2026, which projects ...
> blog
Budget News
President’s FY 2025 Budget Release Scheduled for March 11
Although the FY 2024 appropriations process is not yet resolved
Biden to Release Budget March 9
will press McCarthy On Default Risk - Bloomberg
Biden to Release 2023 Budget Request on March 28
how the administration expects to spend money for priorities including aid to Ukraine and the continuing effort to fight the coronavirus pandemic, as well as legislative proposals such as increased funding for community policing programs, cancer research, and mental health education.
> archive
Spend Links
us numbers • us budget • custom chart • deficit/gdp • spend/gdp • debt/gdp • us gdp • us real gdp • state gdp • breakdown • federal • state • local • 2024 • 2025 • 2026 • california • texas
