
|
Revenue Analyses:
Income Tax Analyses:
Numbers — Charts:
| Tweet | | Contact | Follow @chrischantrill |

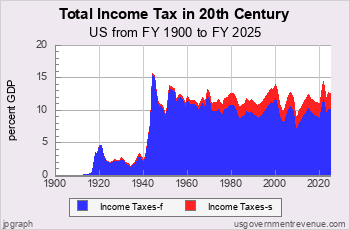
What is the US Income Tax Revenue?
In FY 2025, total US income tax revenue — federal, state and local — was $3,972 billion according to the Office of Management and Budget report of federal revenue and usgovernmentrevenue.com’s “guesstimate” of state income taxes. Individual income taxes collected $3,306 billion and corporate income taxes collected $666 billion.
Estimated total income tax revenue — federal, state and local — for FY 2026 is $3,915 billion.
Total US Income Tax Analysis
This page shows the current trends in US National Income Tax revenue. There are also charts on US National Income Tax revenue history.
Recent US Total Income Tax Revenue


Revenue Analyses:
Income Tax Analyses:
Numbers — Charts:


Suggested Video: All About Income Tax
Top Revenue Requests:
Find DEFICIT stats and history.
US BUDGET overview and pie chart.
Find NATIONAL DEBT today.
DOWNLOAD revenue data.
See FEDERAL BUDGET breakdown and estimated vs. actual.
Check INCOME TAX details and history.
See BAR CHARTS of revenue.
Check STATE revenue: CA NY TX FL and compare.
See REVENUE ANALYSIS briefing.
See REVENUE HISTORY briefing.
Take a COURSE at Taxes 101.
Make your own CUSTOM CHART.
Revenue Data Sources
Revenue data is from official government sources.
- Federal revenue data since 1962 comes from the president’s budget.
- All other revenue data comes from the US Census Bureau.
Gross Domestic Product data comes from US Bureau of Economic Analysis and measuringworth.com.
Detailed table of revenue data sources here.
Federal revenue data begins in 1792.
State and local revenue data begins in 1820.
State and local revenue data for individual states begins in 1957.

Site Search
Spending 101
Take a course in government spending:
Spending |
Federal Debt |
Revenue
Defense |
Welfare |
Healthcare |
Education
Debt History |
Entitlements |
Deficits
State Spending |
State Taxes |
State Debt
It’s free!
Win Cash for Bugs
File a valid bug report and get a $5 Amazon Gift Certificate.
Get the Books
 Price: $0.99 Or download for free. |
 From usgovernment spending.com Price: $1.99 |
 Life after liberalism Price: $0.99 Or download for free. |
Data Sources for 2014_2031:
Sources for 2014:
GDP, GO: GDP, GO Sources
Federal: Fed. Budget: Hist. Tables 3.2, 5.1, 7.1
State and Local: State and Local Gov. Finances
Sources for 2031:
GDP, GO: GDP, GO Sources
Federal: Fed. Budget: Hist. Tables 3.2, 5.1, 7.1
State and Local: State and Local Gov. Finances
'Guesstimated' by projecting the latest change in reported spending forward to future years
> data sources for other years
> data update schedule.
Blog
Gross State Product for 2025
The US Bureau of Economic Analysis (BEA) released its Gross State Product (GSP) data for 2025 on April 9, 2026.
Usgovernmentspending.com has updated its individual state GSPs for 2025 for each state using the projected national GDP numbers from Table 10.1 in the Historical Tables for the Federal FY2027 Budget and the historical GDP data series from the BEA as a baseline.
Process:
- Click on link.
- Click on "Interactive Data" link
- Click on "Interactive Tables: GDP by State" link
- Click on "Annual Gross Domestic Product (GDP) by State"
- Click on "Summary Tables for GDP, personal income, and related data."
- Click on "SASUMMARY"
- Area: Select "All Areas"
- Statistic: Select "Real GDP..." and "Gross domestic product (GDP)"
- Click on Next Step button
- Time Period: Select "All Years"
- Click on Next Step button
- Click on Download button
- Select CSV
On April 4, 2026, we updated usgovernmentspending.com with the numbers from the Public Budget Database in the Budget of the United ...
On March 15, 2026 usgovernmentspending.com updated its GDP series with the latest data from the Bureau of Economic Analysis ...
> blog
