
|
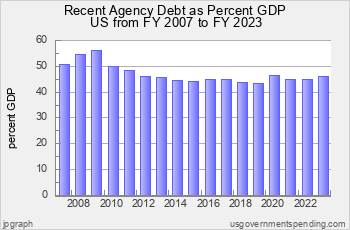
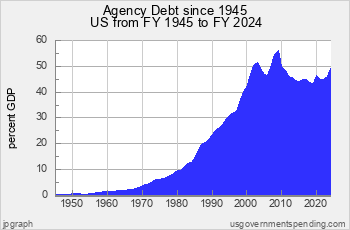
What is Agency Debt?
This page shows Agency Debt.
Agency Debt: That’s the amount of debt outstanding issued by federal agencies (such as FHLB and GNMA) and government-sponsored enterprises (such as Fannie Mae and Freddie Mac).
Up to now, Agency Debt has not been included in the total debt of the United States government as published by the United States Department of the Treasury.
Agency Debt is obtained from the “Financial Accounts of the United States (Z.1)” published by the Federal Reserve Board.
Spending Analyses:
Debt, Deficit Analyses:
Numbers — Charts:
| Tweet | | Contact | Follow @chrischantrill |
Federal Debt Clock
Today the Federal Debt is about $39,283,052,266,270.91.
The amount is the gross outstanding debt issued by the United States Department of the Treasury since 1790 and reported here.
But, it doesn’t include state and local debt.
And, it doesn’t include so-called “agency debt.”
And, it doesn’t include the so-called unfunded liabilities of entitlement programs like Social Security and Medicare.
Federal Debt per person is about $120,389.
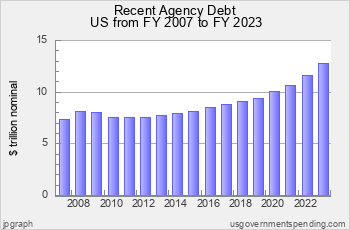
Projected and Recent US Agency Debt Numbers
| Fiscal Year | Total Agency Debt | GSE Debt | Agency/GSE Mortgage Pool Debt |
| 2017 | $8.84 trln | $6.71 trln | $2.13 trln |
| 2018 | $9.09 trln | $6.80 trln | $2.29 trln |
| 2019 | $9.41 trln | $7.00 trln | $2.41 trln |
| 2020 | $10.07 trln | $7.64 trln | $2.43 trln |
| 2021 | $10.68 trln | $8.18 trln | $2.50 trln |
| 2022 | $11.66 trln | $8.97 trln | $2.69 trln |
| 2023 | $11.96 trln | $9.09 trln | $2.87 trln |
| 2024 | $12.25 trln | $9.21 trln | $3.04 trln |
| 2025 | $12.56 trln | $9.34 trln | $3.23 trln |
| 2026* | $12.89 trln | $9.46 trln | $3.42 trln |
Note:
* Agency Debt after 2025 is “guesstimated.”
Agency Debt Charts also: Spending Charts Revenue Charts Debt Charts Deficit Charts
Recent US Agency/GSE Debt
Site Search
Spending 101
Take a course in government spending:
Spending |
Federal Debt |
Revenue
Defense |
Welfare |
Healthcare |
Education
Debt History |
Entitlements |
Deficits
State Spending |
State Taxes |
State Debt
It’s free!
Win Cash for Bugs
File a valid bug report and get a $5 Amazon Gift Certificate.
Gross Federal Debt
| Debt Now: | $39,283,052,266,270.91 | Debt 2/2020: | $23,409,959,150,243.63 |
Data Sources for 2021_2031:
Sources for 2021:
GDP, GO: GDP, GO Sources
Federal: Fed. Budget: Hist. Tables 3.2, 5.1, 7.1
State and Local: State and Local Gov. Finances
'Guesstimated' by projecting the latest change in reported spending forward to future years
Sources for 2031:
GDP, GO: GDP, GO Sources
Federal: Fed. Budget: Hist. Tables 3.2, 5.1, 7.1
State and Local: State and Local Gov. Finances
'Guesstimated' by projecting the latest change in reported spending forward to future years
> data sources for other years
> data update schedule.
Get the Books
 Price: $0.99 Or download for free. |
 From usgovernment spending.com Price: $1.99 |
 Life after liberalism Price: $0.99 Or download for free. |
Medicare/Social Security 2026 Trustees Report Released
On June 16, 2026, the Center for Medicare Services released its annual Medicare Trustees Report, which projects Medicare spending out to 2095. As in the past, the report shows that federal health-care programs will eat the budget.
In this report the Trustees forecast that Medicare will top out at a little above 6 percent of GDP in the 2080s.
On June 15, 2026, usgovernmentspending.com updated its chart of the Medicare Outlook here based on data in the 2026 Medicare Trustees Report. You can download the data and also view selected Medicare Trustee forecasts going back to 2005.
In June 2026, the Social Security Administration released its annual OASDI Trustees Report, which projects Social Security spending out to 2095. As in the past, the report shows that Social Security spending will max out at about 6 percent of GDP. UsGovernmentspending.com uses the Supplemental Single Year Tables.
On June 15, 2026, usgovernmentspending.com updated its chart of the Social Security Outlook here based on data in the 2026 OASDI Trustees Report. You can download the data and also view selected OASDI Trustee forecasts going back to 1997.
Blog
Medicare/Social Security 2026 Trustees Report Released
On June 16, 2026, the Center for Medicare Services released its annual Medicare Trustees Report, which projects Medicare spending out to 2095. As in the past, the report shows that federal health-care programs will eat the budget.
In this report the Trustees forecast that Medicare will top out at a little above 6 percent of GDP in the 2080s.
On June 15, 2026, usgovernmentspending.com updated its chart of the Medicare Outlook here based on data in the 2026 Medicare Trustees Report. You can download the data and also view selected Medicare Trustee forecasts going back to 2005.
In June 2026, the Social Security Administration released its annual OASDI Trustees Report, which projects Social Security spending out to 2095. As in the past, the report shows that Social Security spending will max out at about 6 percent of GDP. UsGovernmentspending.com uses the Supplemental Single Year Tables.
On June 15, 2026, usgovernmentspending.com updated its chart of the Social Security Outlook here based on data in the 2026 OASDI Trustees Report. You can download the data and also view selected OASDI Trustee forecasts going back to 1997.
On February 25, 2026 the Congressional Budget Office released its annual Long Term Budget Outlook for 2026, which projects ...
The US Bureau of Economic Analysis (BEA) released its Gross State Product (GSP) data for 2025 on April 9, 2026.Usgovernment ...
> blog
