
|
Spending Analyses:
Debt, Deficit Analyses:
Numbers — Charts:
| Tweet | | Contact | Follow @chrischantrill |

What is the spending on Social Security?
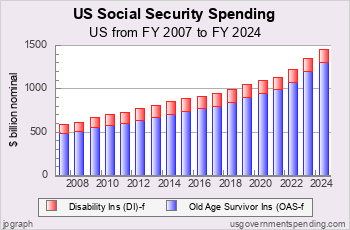
In FY 2025 the federal government spent $1,581 billion on Social Security.
Social Security Spending Analysis
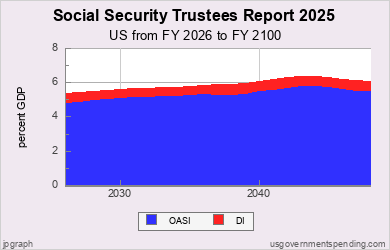
This page shows the current trends in Social Security spending on the OASI and DI programs. There are also charts on OASI and DI spending history. See here for a general history of entitlement spending. See here for spending forecast from latest OASDI Trustees Report.
Recent Social Security Spending
Spending Analyses:
Debt, Deficit Analyses:
Numbers — Charts:
US Social Security Spending Since 1935
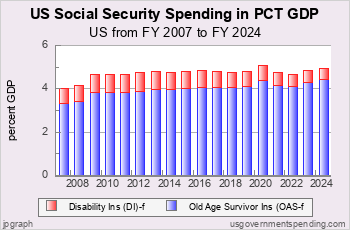
Social Security benefits cost about 5 percent of GDP each year.
Social Security Program Growth

Chart S.13f: Social Security Spending since 1935
Social Security, the federal old-age pension program, was passed in 1935 in time for the 1936 presidential election. The first old-age benefits were distributed in 1938.
Social Security benefits were modest in the early years and did not exceed one percent of GDP until 1955. But the program cost increased rapidly, reaching 2.2 percent of GDP in 1960.
Benefit increase slowed somewhat in the 1960s, reaching 3.2 percent in 1971. Costs increased again in the early 1970s before peaking at 4.81 percent in 1983.
Social Security benefits as a percent of GDP slowly declined for the rest of the 1980s, 1990s and 2000s down to a low of 4.0 percent of GDP in 2005. But the Great Recession o 2007-09 bumped Social Security up to 4.72 percent of GDP in 2010. Social Security spending has been just under 5 percent GDP since 2013. In 2025 Social Security spending was 5.14 percent GDP.
Social Security Disability Insurance Growth
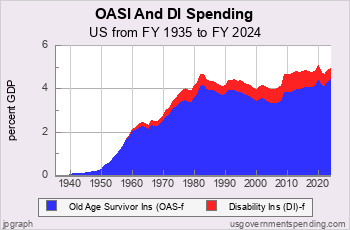
Chart S.14f: Social Security Spending
The Social Security Disability Insurance Program was enacted in the 1950s and payments began in 1958. Eligibility requirements relaxed in the 1980s.
Starting from zero in 1957 Social Security’s Disability Insurance program reached 0.5 percent of GDP in 1975.
Peaking at 0.55 percent of GDP in the early 1980s, payments declined to a low of 0.43 percent in 1990. But then payments increased, breaching 0.5 percent of GDP in 1993 and 0.6 percent of GDP in 2002. DI reached 0.7 percent of GDP in 2006 and peaked at 0.85 percent of GDP in 2011-13. In 2025 DI was 0.52 percent GDP.
Suggested Video: Spending 101
Top Spending Requests:
Find DEFICIT stats and history.
Get WELFARE stats and history.
US BUDGET overview and pie chart.
Find NATIONAL DEBT today.
DOWNLOAD spending data or debt data.
See FEDERAL BUDGET breakdown and estimated vs. actual.
MILITARY SPENDING details, budget and history.
ENTITLEMENT SPENDING history.
See BAR CHARTS of spending, debt.
Check STATE spending: CA NY TX FL and compare.
See SPENDING ANALYSIS briefing.
See SPENDING HISTORY briefing.
Take a COURSE at Spending 101.
Make your own CUSTOM CHART.
Spending Data Sources
Spending data is from official government sources.
- Federal spending data since 1962 comes from the president’s budget.
- All other spending data comes from the US Census Bureau.
Gross Domestic Product data comes from US Bureau of Economic Analysis and measuringworth.com.
Detailed table of spending data sources here.
Medicare breakdown here; Medicaid breakdown here.
Federal spending data begins in 1792.
State and local spending data begins in 1820.
State and local spending data for individual states begins in 1957.

Gross Federal Debt
| Debt Now: | $39,394,977,645,639.05 | Debt 2/2020: | $23,409,959,150,243.63 |
Site Search
Spending 101
Take a course in government spending:
Spending |
Federal Debt |
Revenue
Defense |
Welfare |
Healthcare |
Education
Debt History |
Entitlements |
Deficits
State Spending |
State Taxes |
State Debt
It’s free!
Win Cash for Bugs
File a valid bug report and get a $5 Amazon Gift Certificate.
Get the Books
 Price: $0.99 Or download for free. |
 From usgovernment spending.com Price: $1.99 |
 Life after liberalism Price: $0.99 Or download for free. |
Data Sources for 2021_2031:
Sources for 2021:
GDP, GO: GDP, GO Sources
Federal: Fed. Budget: Hist. Tables 3.2, 5.1, 7.1
State and Local: State and Local Gov. Finances
'Guesstimated' by projecting the latest change in reported spending forward to future years
Sources for 2031:
GDP, GO: GDP, GO Sources
Federal: Fed. Budget: Hist. Tables 3.2, 5.1, 7.1
State and Local: State and Local Gov. Finances
'Guesstimated' by projecting the latest change in reported spending forward to future years
> data sources for other years
> data update schedule.
Blog
State and Local Finances for 2024 -- First Look
On July 2, 2026 we updated the state and local spending and revenue for FY 2024 using the new Census Bureau State and Local Government Finances "first look"summaries for FY 2024 released in April 2026. (See also Annual Survey of State and Local Government Finances). The release includes state and local spending for the United States as a whole. It does not include the 50 individual states and the District of Columbia.
State and local spending and revenue for FY2024 are now actual historical spending as reported by the Census Bureau.
We have updated the "guesstimated" state and local finances for FY2025-31 as indicated in our "guesstimate" blog entries.
Beginning in 2021, the Census Bureau stopped splitting "Public welfare" into three parts:
- Cash assistance payments
- Vendor payments
- Other public welfare
On June 16, 2026, the Center for Medicare Services released its annual ...
On February 25, 2026 the Congressional Budget Office released its annual Long Term Budget Outlook for 2026, which projects ...
> blog
Budget News
President’s FY 2025 Budget Release Scheduled for March 11
Although the FY 2024 appropriations process is not yet resolved
Biden to Release Budget March 9
will press McCarthy On Default Risk - Bloomberg
Biden to Release 2023 Budget Request on March 28
how the administration expects to spend money for priorities including aid to Ukraine and the continuing effort to fight the coronavirus pandemic, as well as legislative proposals such as increased funding for community policing programs, cancer research, and mental health education.
> archive
Spend Links
us numbers • us budget • custom chart • deficit/gdp • spend/gdp • debt/gdp • us gdp • us real gdp • state gdp • breakdown • federal • state • local • 2024 • 2025 • 2026 • california • texas
