
|
What is the Federal Grant Spending?
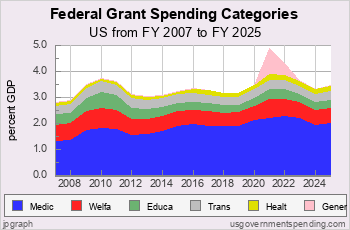
In the Public Budget Database each spending item is tagged as Grant or Nongrant. This analysis shows history of federal grant spending as distributed across various federal functions. The biggest grant item is Medicaid grants to states.
Spending Analyses:
Debt, Deficit Analyses:
Numbers — Charts:
| Tweet | | Contact | Follow @chrischantrill |

Federal Grant Analysis
Recent US Federal Grant Spending


Suggested Video: All About Debt
Top Debt Requests:
Find DEFICIT stats and history.
US BUDGET overview and pie chart.
Find NATIONAL DEBT today.
See FEDERAL BUDGET breakdown and estimated vs. actual.
Check STATE debt: CA NY TX FL and compare.
See DEBT ANALYSIS briefing.
See DEBT HISTORY briefing.
Take a COURSE at Spending 101.
Make your own CUSTOM CHART.
Debt Data Sources
Debt data is from official government sources.
- Federal debt data since 1962 comes from the president’s budget.
- Federal debt for 1940-1961 comes from the president’s budget.
- Federal debt for 1914-1939 comes from the
US Treasury
and St. Louis Fed.
- Federal debt before 1914 comes from the
US Treasury
- All other debt data comes from the US Census Bureau.
Gross Domestic Product data comes from US Bureau of Economic Analysis and measuringworth.com.
Detailed table of debt data sources here.
Federal debt data begins in 1792.
State and local debt data begins in 1820.
State and local debt data for individual states begins in 1957.
Gross Federal Debt
| Debt Now: | $37,889,756,572,760.44 | Debt 2/2020: | $23,409,959,150,243.63 |
Site Search
Spending 101
Take a course in government spending:
Spending |
Federal Debt |
Revenue
Defense |
Welfare |
Healthcare |
Education
Debt History |
Entitlements |
Deficits
State Spending |
State Taxes |
State Debt
It’s free!
Win Cash for Bugs
File a valid bug report and get a $5 Amazon Gift Certificate.
Get the Books
 Price: $0.99 Or download for free. |
 From usgovernment spending.com Price: $1.99 |
 Life after liberalism Price: $0.99 Or download for free. |
Data Sources for 2021_2029:
Sources for 2021:
GDP, GO: GDP, GO Sources
Federal: Fed. Budget: Hist. Tables 3.2, 5.1, 7.1
State and Local: State and Local Gov. Finances
'Guesstimated' by projecting the latest change in reported spending forward to future years
Sources for 2029:
GDP, GO: GDP, GO Sources
Federal: Fed. Budget: Hist. Tables 3.2, 5.1, 7.1
State and Local: State and Local Gov. Finances
'Guesstimated' by projecting the latest change in reported spending forward to future years
> data sources for other years
> data update schedule.
Blog
State FY25 Taxes Update
On November 22, 2025 usgovernmentspending.com updated FY2025 state revenue with quarterly tax data released by the US Census Bureau on September 2, 2025. Local tax data was updated by assuming that local taxes for 2024 changed by the same percent as state taxes of the same type.
| $ billion | FY2025 Estimate | FY2025 Actual |
| State Income Tax Revenue | $908 | $798 |
| Total State Revenue | $2,815 | $3.072 |
State and local spending projections for FY2026 to FY2029 have been reestimated using the "Guesstimate" method.
The US Bureau of Economic Analysis (BEA) released its Gross State Product (GSP) data for 2024 on March 29, 2025.Usgovernmen ...
On October 16, 2025, the US Treasury reported in its Monthly Treasury Statement (and ...
> blog
Budget News
President’s FY 2025 Budget Release Scheduled for March 11
Although the FY 2024 appropriations process is not yet resolved
Biden to Release Budget March 9
will press McCarthy On Default Risk - Bloomberg
Biden to Release 2023 Budget Request on March 28
how the administration expects to spend money for priorities including aid to Ukraine and the continuing effort to fight the coronavirus pandemic, as well as legislative proposals such as increased funding for community policing programs, cancer research, and mental health education.
> archive
Spend Links
us numbers • us budget • custom chart • deficit/gdp • spend/gdp • debt/gdp • us gdp • us real gdp • state gdp • breakdown • federal • state • local • 2024 • 2025 • 2026 • california • texas
