US Welfare Spending History from 1900
In 1902 governments in the United States spent very little on relief of the poor, including less than 0.2 percent
of GDP on relief and 0.25 percent of GDP on health care services.
In the early 21st century, governments spend about 2 to 3 percent of GDP on welfare programs.
(Health care for the poor, Medicaid, is described separately below.)
A Century of Welfare Spending
Welfare spending began its ascent during the Great Depression.

Chart 2.61: Welfare Spending in 20th Century
Welfare spending, on programs for relief, unemployment compensation, and income support, started out at the beginning of the 20th century at 0.1 percent of Gross Domestic Product (GDP).
It was not until the crisis of the Great Depression that welfare expenditures began their secular rise,
reaching 2.1 percent of GDP by 1940.
During World War II, welfare expenditures declined to about one percent of GDP per year, and fluctuated between one and
two percent per year, depending on the business cycle. Health care expenditure amounted to about one
percent of GDP. By the early 1960s, welfare cost about two percent of GDP.
The Great Society programs started welfare on an upward path, so that after 1980 welfare spending
fluctuated between 3 and 4 percent of GDP, spiking during recessions.
In 1996 President Clinton signed a reform of welfare, and welfare costs declined from 3.4 percent of GDP during the 1990-91 recession to a low of 2.4 percent of GDP in 2000.
In the 2001-02 recession welfare costs increased to 3.1 percent of GDP in 2003 and then declined to 2.5 percent of
GDP by 2007. But the Great Recession of 2009-10 produced an explosion in welfare costs to a peak of 4.75 percent
of GDP in 2010. Welfare declined to 2.5 percent of GDP by 2015.
In the COVID crisis of 2020 welfare spending exploded to 6.3 percent GDP.
In 2025 welfare spending was estimated at
2.6 percent GDP.
See also Welfare Spending Analysis.
Governments Sharing the Cost of the Poor
When government spending on welfare began to expand in the Great Depression, it was mainly a state and local affair. But in the 1960s the federal government got into welfare in a big way.
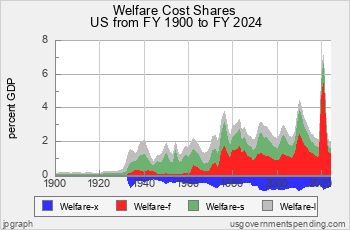
Chart 2.62: Welfare Cost by Government Share
Prior to the Great Depression, non-health care expenditures on the poor were minimal, less than 0.2 percent of GDP. But in the Great Depression state and local governments sharply increased spending on welfare, with an initial boost from the federal government, and expenditures reached 2 percent of GDP in 1940.
Between 1940 and 1960 welfare was mainly borne by state governments, with total cost fluctuating between 1 and 2 percent of GDP including a 0.5 percent GDP contribution from the federal government.
Chart Key:

- Local direct spending

- State direct spending

- Federal direct spending

- Transfer to state and local
In the 1960s the federal government started to dominate welfare spending, contributing about half of the 4 percent of GDP cost by the early 1980s and about two-thirds of the 4.5 percent of GDP peak cost in the Great Recession in 2010.
In the 2010s federal welfare spending declined off a peak of 3.31 percent GDP in 2010 (including 0.88 percent GDP transferred to states) to
2.0 percent GDP in 2015 (including 0.62 percent GDP transferred to states). State welfare spending declined from 1.45 percent GDP in 2010 to 0.64 percent in 2015.
Local welfare spending has declined from 0.60 percent GDP in 2010 to
0.49 percent GDP in 2015.
In 2021 federal welfare spending was 6.46 percent GDP, state welfare spending was estimated at 1.20 percent GDP and
local welfare spending was estimated at 0.50 percent GDP.
Relief, or Income Security Payments
There are three major welfare programs: relief (or income security), housing rent subsidies,
and unemployment benefits.
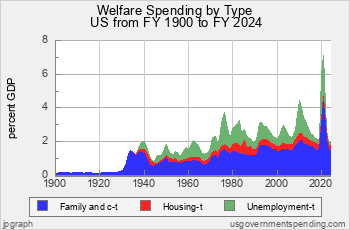
Chart 2.63: The Three Major Welfare Programs
Prior to the Great Depression, the only welfare program was direct relief, then called “public welfare” or “public assistance.” It cost about 0.1 to 0.15 percent of GDP. Then relief payments surged to 0.75 percent in 1932, 1.25 percent in
1933, peaking at nearly 1.5 percent of GDP in 1934.
Chart Key:
- Unemployment
- Housing
- Relief (income security)
In the mid 1930s welfare became differentiated into public assistance, housing subsidy, and unemployment
benefits. Housing and unemployment are treated below. Public assistance payments peaked at 1.4 percent of GDP in the 1938 recession.
Welfare benefits declined in World War II, with income security at 0.51 percent GDP in 1944.
After World War II relief payments steadied at a little below 1 percent of GDP.
In the mid 1960s came the War on Poverty. Public assistance payments doubled to 1.8 percent GDP by the mid 1970s.
In 1991 after the 1990 recession, income security benefits peaked at 1.97 percent of GDP,
after 15 years ranging between 1.6 and 1.8 percent of GDP.
But then they began to decline throughout the 1990s, and President Clinton signed a reform of welfare in 1996.
Income security benefits hit a low of 1.24 percent GDP in 2001.
In the 2000s income security benefits stayed below 1.4 percent of GDP, but in the Great Recession they cranked
up to 1.85 percent of GDP in 2011. Income security benefits,
including Supplemental Nutrition Assistance Program (SNAP),
Earned Income Tax Credit (EITC),
Supplemental Security Income (SSI),
and Temporary Assistance to Needy Families (TANF),
declined to 1.56 percent of GDP in 2015.
In the COVID crisis of 2021 income security payments exploded to 4.57 percent GDP.
Rental Housing Subsidies
Housing subsidies steadily increased from the 1930s to the early 1980s.

Chart 2.64: Subsidies for Rental Housing
Prior to the Great Depression, the only welfare program was direct relief, but a program of housing allowances emerged as part of the New Deal ethos.
In the mid 1930s housing spending quickly increased from zero to 0.1 percent of GDP in 1937 before peaking
at 0.37 percent of GDP in 1942. After World War II housing spending declined down to about 0.1 percent GDP.
Starting at 0.09 percent of GDP in 1948 housing spending expanded briskly over the next three decades, hitting
0.2 percent GDP in 1951, 0.3 percent GDP in 1972, 0.4 percent GDP in 1980. Housing spending spiked to 0.82 percent
of GDP in 1985 with a special payment for low-income housing loan programs.
Since the spike in the mid 1980s, housing spending has settled down in the range 0.5 to 0.55 percent of GDP.
Housing spending peaked at 0.69 percent of GDP in the recession year of 2010, and declined to 0.3 percent of GDP in 2015.
in 2021 federal rental housing subsidies were 0.62 percent GDP.
Unemployment Benefits
Unemployment benefits peak during recessions, but have a base of about 0.5 percent GDP
at the peak of the business cycle.
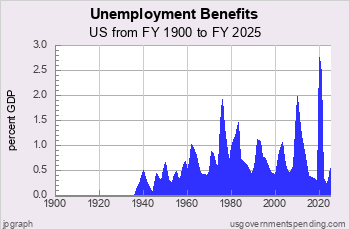
Chart 2.65: Unemployment Benefits
In the aftermath of the Great Depression governments all worked to create government-based unemployment systems to
pay benefits to laid-off workers from taxes laid on employers.
In the mid 1930s governments started making unemployment benefit payments to unemployed workers, increasing
from zero to 0.49 percent of GDP by 1940. During World War II unemployment benefit payments decreased to
0.03 percent of GDP in 1944.
In the 1950s unemployment benefits hit about 0.7 percent GDP during recessions and declined to about 0.3 percent
GDP during good times. Unemployment spending peaked at just over 1 percent of GDP in 1962 and then declined
to about 0.4 percent during the mid-1960s boom.
Unemployment benefits spiked to 0.87 percent of GDP in 1971 after the mild recession of 1969-70, and to 1.9
percent of GDP in 1976 after the much more severe recession of 1974-75.
In the 1980s and thereafter, unemployment spending declined to about 0.5 percent of GDP at the peak of an
economic boom and spiked upwards after each recession. On that record the most severe recession has been
the Great Recession of 2008-09. Unemployment benefit payments peaked at 1.98 percent of GDP in 2010.
By 2015 unemployment benefit spending declined to 0.4 percent of GDP.
In the aftermath of COVID in 2021 unemployment benefit was 2.15 percent GDP.
Government Healthcare Spending on the Poor
Governments spent up to one percent of GDP on health care for the poor until the 1960s.
Now the total is reaching 4 percent of GDP. (This excludes Medicare, the federal health program for senior citizens.)

Chart 2.66: Medicaid and Government Health Care
Health care expenditures by governments, mainly state and local, began the 20th century at about 0.25 percent of GDP. By 1960, after a temporary decline in World War II, expenditures had reached about one percent of GDP.
The joint federal-state Medicaid program to deliver health care for the poor (shown in red) began in the 1960s and reached 1 percent GDP in 1991. In the 1990s Medicaid increased rapidly, doubling to 2 percent of GDP in 2002. Thereafter it increased steadily, year after year, reached 3.33 percent of GDP in 2015.
In 2020 Medicaid payments hit 4.2 percent GDP and eased off to 3.87 percent GDP in 2021.
Other health care
expenditures (mainly state and local) reached 1 percent of GDP in the mid 1970s and have slowly increased since then, reaching 1.35 percent GDP in 2015.
In 2021 other health care expenditures were 1.39 percent GDP.


