
|
Spending Analyses:
Debt, Deficit Analyses:
Numbers — Charts:
| Tweet | | Contact | Follow @chrischantrill |

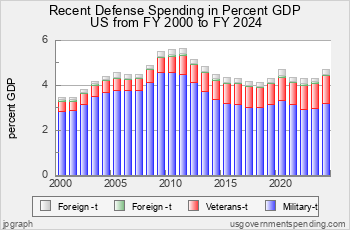
What is the spending on Defense?
In FY 2025 the federal government spent $1,340.1 billion on Defense.
That includes $915.7 billion on the military, $379.3 billion on veterans, and $45.2 billion on foreign aid.
Defense Spending Analysis
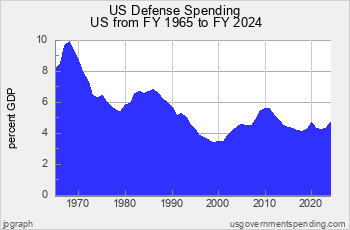
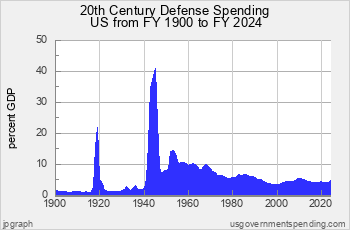
This page shows the current trends in defense spending. See here for a general history of US defense spending.
Recent Defense Spending

Spending Analyses:
Debt, Deficit Analyses:
Numbers — Charts:
Suggested Video: US Defense Spending
Top Spending Requests:
Find DEFICIT stats and history.
Get WELFARE stats and history.
US BUDGET overview and pie chart.
Find NATIONAL DEBT today.
DOWNLOAD spending data or debt data.
See FEDERAL BUDGET breakdown and estimated vs. actual.
MILITARY SPENDING details, budget and history.
ENTITLEMENT SPENDING history.
See BAR CHARTS of spending, debt.
Check STATE spending: CA NY TX FL and compare.
See SPENDING ANALYSIS briefing.
See SPENDING HISTORY briefing.
Take a COURSE at Spending 101.
Make your own CUSTOM CHART.
Spending Data Sources
Spending data is from official government sources.
- Federal spending data since 1962 comes from the president’s budget.
- All other spending data comes from the US Census Bureau.
Gross Domestic Product data comes from US Bureau of Economic Analysis and measuringworth.com.
Detailed table of spending data sources here.
Medicare breakdown here; Medicaid breakdown here.
Federal spending data begins in 1792.
State and local spending data begins in 1820.
State and local spending data for individual states begins in 1957.

Gross Federal Debt
| Debt Now: | $37,889,756,572,760.44 | Debt 2/2020: | $23,409,959,150,243.63 |
Site Search
Spending 101
Take a course in government spending:
Spending |
Federal Debt |
Revenue
Defense |
Welfare |
Healthcare |
Education
Debt History |
Entitlements |
Deficits
State Spending |
State Taxes |
State Debt
It’s free!
Win Cash for Bugs
File a valid bug report and get a $5 Amazon Gift Certificate.
Get the Books
 Price: $0.99 Or download for free. |
 From usgovernment spending.com Price: $1.99 |
 Life after liberalism Price: $0.99 Or download for free. |
Data Sources for 2021_2029:
Sources for 2021:
GDP, GO: GDP, GO Sources
Federal: Fed. Budget: Hist. Tables 3.2, 5.1, 7.1
State and Local: State and Local Gov. Finances
'Guesstimated' by projecting the latest change in reported spending forward to future years
Sources for 2029:
GDP, GO: GDP, GO Sources
Federal: Fed. Budget: Hist. Tables 3.2, 5.1, 7.1
State and Local: State and Local Gov. Finances
'Guesstimated' by projecting the latest change in reported spending forward to future years
> data sources for other years
> data update schedule.
Blog
Federal Deficit, Receipts, Outlays Actuals for FY 2025
On October 16, 2025, the US Treasury reported in its Monthly Treasury Statement (and xlsx) for September that the federal deficit for FY 2025 ending September 30, 2025, was $1,775 billion. Here are the numbers, including total receipts, total outlays, and deficit compared with the numbers projected in the FY 2025 federal budget published in February 2024:
| Federal Finances FY 2025 Outcomes | |||
|---|---|---|---|
| Budget billions | Outcome billions | ||
| Receipts | $5,485 | $5,235 | |
| Outlays | $7,226 | $7,010 | |
| Deficit | $1,781 | $1,775 | |
We use the spending projections from the FY 2025 budget because the Federal government did not publish spending projections in its Budget for Fiscal Year 2026 as originally published in May 2025.
The Monthly Treasury Statement includes "Table 4: Receipts of the United States Government, September 2025 and Other Periods." This table of receipts by source is used for usgovernmentspending.com to post details of federal receipt actuals for FY 2025. usdgovernmentspending.com obtains the data for outlays and receipts from apis at fiscaldata.treasury.gov.
This MTS report on FY 2025 actuals is a problem for usgovernmentspending.com because this site uses Historical Table 3.2--Outlays by Function and Subfunction from the Budget of the United States as its basic source for federal subfunction outlays. But the Monthly Treasury Statement only includes "Table 9. Summary of Receipts by Source, and Outlays by Function of the U.S. Government, September 2025 and Other Periods". Subfunction amounts don't get reported until the FY27 budget in February 2026. Until then usgovernmentspending.com estimates actual outlays by "subfunction" for FY 2025 by factoring subfunction budgeted amounts for FY25 by the ratio between relevant actual and budgeted "function" amounts where actual outlays by subfunction cannot be gleaned from the Monthly Treasury Statement.
On September 11, 2025 we updated the state and local spending and revenue for FY 2023 using the new Census Bureau ...
In March 2025 the US Census Bureau released data on state finances for FY 2023 here and ...
> blog
Budget News
President’s FY 2025 Budget Release Scheduled for March 11
Although the FY 2024 appropriations process is not yet resolved
Biden to Release Budget March 9
will press McCarthy On Default Risk - Bloomberg
Biden to Release 2023 Budget Request on March 28
how the administration expects to spend money for priorities including aid to Ukraine and the continuing effort to fight the coronavirus pandemic, as well as legislative proposals such as increased funding for community policing programs, cancer research, and mental health education.
> archive
Spend Links
us numbers • us budget • custom chart • deficit/gdp • spend/gdp • debt/gdp • us gdp • us real gdp • state gdp • breakdown • federal • state • local • 2024 • 2025 • 2026 • california • texas
