
|
Spending Analyses:
Debt, Deficit Analyses:
Numbers — Charts:
| Tweet | | Contact | Follow @chrischantrill |
Federal Budget Chart Gallery
CREATE CUSTOM CHART |
DETAILED BUDGET NUMBERS
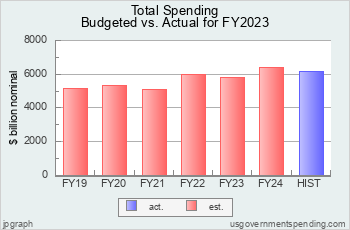
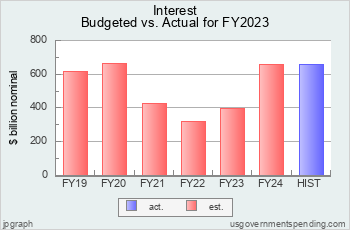
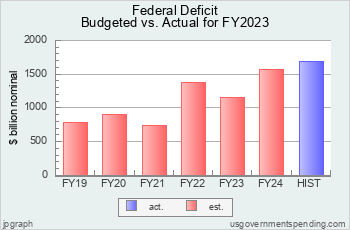
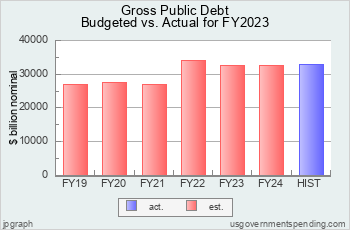
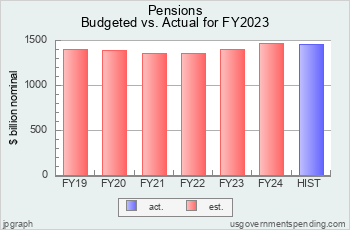
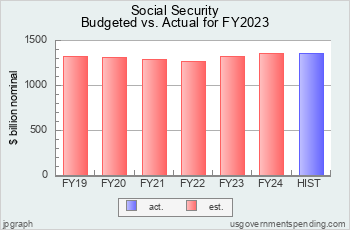
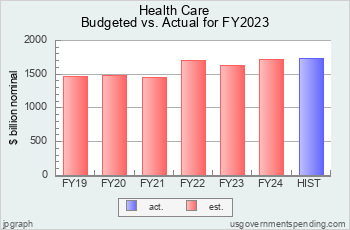
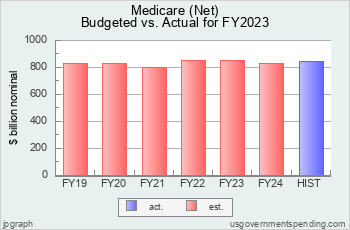
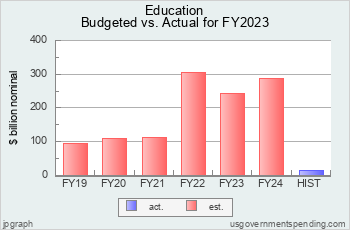
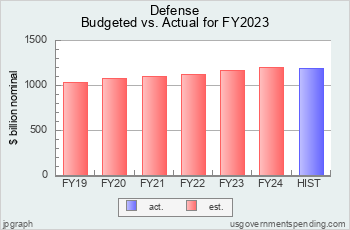
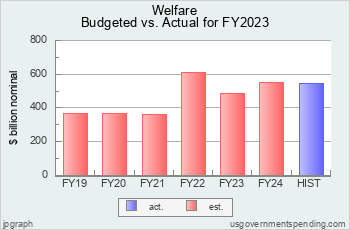
Each of the following charts shows six federal budget outlay estimates for the latest fiscal year, FY2025, in previous budgets, and the actual outlays reported by the Office of Management and Budget for FY2025.
Federal Budget: Total Spending
Estimate vs. Actual for:
Total Spending in FY2025
Federal Budget: Interest
Estimate vs. Actual for:
Interest in FY2025
Federal Budget: Federal Deficit
Estimate vs. Actual for:
Federal Deficit in FY2025
Federal Budget: Federal Debt
Estimate vs. Actual for:
Federal Debt in FY2025
Federal Budget: Pensions
Estimate vs. Actual for:
Pensions in FY2025
Federal Budget: Social Security
Estimate vs. Actual for:
Social Security in FY2025
Federal Budget: Health Care
Estimate vs. Actual for:
Health Care in FY2025
Federal Budget: Medicare
Estimate vs. Actual for:
Medicare in FY2025
Federal Budget: Education
Estimate vs. Actual for:
Education in FY2025
Federal Budget: Defense
Estimate vs. Actual for:
Defense in FY2025
Federal Budget: Welfare
Estimate vs. Actual for:
Welfare in FY2025
Federal Budget: Transportation
Estimate vs. Actual for:
Transportation in FY2025
Suggested Video: US Defense Spending
Top Spending Requests:
Find DEFICIT stats and history.
Get WELFARE stats and history.
US BUDGET overview and pie chart.
Find NATIONAL DEBT today.
DOWNLOAD spending data or debt data.
See FEDERAL BUDGET breakdown and estimated vs. actual.
MILITARY SPENDING details, budget and history.
ENTITLEMENT SPENDING history.
See BAR CHARTS of spending, debt.
Check STATE spending: CA NY TX FL and compare.
See SPENDING ANALYSIS briefing.
See SPENDING HISTORY briefing.
Take a COURSE at Spending 101.
Make your own CUSTOM CHART.
Spending Data Sources
Spending data is from official government sources.
- Federal spending data since 1962 comes from the president’s budget.
- All other spending data comes from the US Census Bureau.
Gross Domestic Product data comes from US Bureau of Economic Analysis and measuringworth.com.
Detailed table of spending data sources here.
Medicare breakdown here; Medicaid breakdown here.
Federal spending data begins in 1792.
State and local spending data begins in 1820.
State and local spending data for individual states begins in 1957.
Gross Federal Debt
| Debt Now: | $38,380,536,147,996.03 | Debt 2/2020: | $23,409,959,150,243.63 |
Site Search
Spending 101
Take a course in government spending:
Spending |
Federal Debt |
Revenue
Defense |
Welfare |
Healthcare |
Education
Debt History |
Entitlements |
Deficits
State Spending |
State Taxes |
State Debt
It’s free!
Win Cash for Bugs
File a valid bug report and get a $5 Amazon Gift Certificate.
Get the Books
 Price: $0.99 Or download for free. |
 From usgovernment spending.com Price: $1.99 |
 Life after liberalism Price: $0.99 Or download for free. |
Data Sources for 2025:
GDP, GO: GDP, GO Sources
Federal: Fed. Budget: Hist. Tables 3.2, 5.1, 7.1
State and Local: State and Local Gov. Finances
'Guesstimated' by projecting the latest change in reported spending forward to future years
> data sources for other years
> data update schedule.
Blog
Medicaid Update for FY2024
On January 14, 2026, the Centers for Medicare and Medicaid Services (CMS) published its annual report on National Health Expenditures and its NHE Tables includes data on Medicaid from 1960 to 2023. On January 15, 2026, usgovernmentspending.com updated its Medicaid data.
| Item | 2024 Estimate | 2024 Actual |
| Federal Medicaid | $567.2 bn | $567.2 bn |
| State Medicaid (net) | $124.4 bn | $253.2 bn |
| Total Medicaid | $691.6 bn | $820.4 bn |
The federal Medicaid number comes from the Federal Budget Subfunction 558: Grants to states for Medicaid. The state contribution comes from the NHE Tables.
usgovernmentspending.com publishes "guesstimates" of state and local spending from the latest year published by the Census Bureau (currently FY 2023) to the last year in the Historical Tables of the federal budget. (currently 2029 from the FY25 budget). So we have developed "guesstimates" of Medicaid spending going out to 2029, assuming that the overall Medicaid spending increases at the same rate as the federal "Grants to States for Medicaid" increases.
National Health Expenditure data is updated each year in mid December.
On March 27, 2025 the Congressional Budget Office released its annual Long Term Budget Outlook for 2025, which projects federal spendin ...
On November 22, 2025 usgovernmentspending.com updated FY2025 state revenue with quarterly tax data released by the US Ce ...
> blog
Budget News
President’s FY 2025 Budget Release Scheduled for March 11
Although the FY 2024 appropriations process is not yet resolved
Biden to Release Budget March 9
will press McCarthy On Default Risk - Bloomberg
Biden to Release 2023 Budget Request on March 28
how the administration expects to spend money for priorities including aid to Ukraine and the continuing effort to fight the coronavirus pandemic, as well as legislative proposals such as increased funding for community policing programs, cancer research, and mental health education.
> archive
Spend Links
us numbers • us budget • custom chart • deficit/gdp • spend/gdp • debt/gdp • us gdp • us real gdp • state gdp • breakdown • federal • state • local • 2024 • 2025 • 2026 • california • texas

usgovernmentspending.com
presented by Christopher Chantrill