
|
Spending Analyses:
Debt, Deficit Analyses:
Numbers — Charts:
| Tweet | | Contact | Follow @chrischantrill |

What is the Deficit?
deficit (surplus) - The amount by which outlays exceed receipts in a given fiscal period. (A surplus would be the amount by which receipts exceed outlays.) —US Senate Glossary
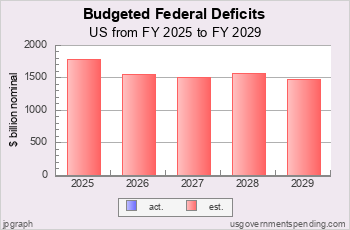
In FY 2025 the federal deficit was $1.77 trillion. But the gross federal debt increased by $2.14 trillion. Here is why.
This year, FY 2026, the federal government in its latest budget has estimated that the deficit will be $2.06 trillion.
Here is the federal deficit by year for the last decade:
| ||||||||||||||||||||||||||||||||||||
Click for deficits from 1960 to present.
See also deficit as percent of GDP.
Federal Deficit Analysis
Recent US Federal Deficits by Year

Budgeted US Federal Deficits
Spending Analyses:
Debt, Deficit Analyses:
Numbers — Charts:
But there’s more
The federal debt increases each year by more than the deficit. For FY 2026 the federal budget estimates that the federal debt will increase by about $1.67 trillion. That’s about $-0.39 trillion more than the official “deficit.” See Federal Debt.
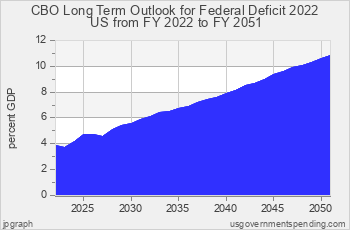
But there’s more. There is the increase in in the “agency debt” of government-sponsored enterprises like the Federal National Mortgage Association. And there is the implied deficit from unfunded liabilities like Social Security and Medicare. See chart of latest Long-term Budget Outlook from the Congressional Budget Office.
Now you are ready to explore. Click here for the basics on the national debt and deficits. Click here for a look at overall government spending; click here for a look at the federal budget by function. And there is no better place to get up to speed than Spending 101’s online course on Federal Debt.
US Federal Deficits in the 20th Century
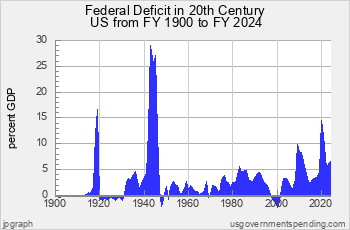
Chart D.03f: Federal Deficits since 1900
The two major peaks of the federal deficit in the 20th century occurred during World War I and World War II.
Deficits increased steadily from the 1960s through the early 1990s, and then declined rapidly for the remainder of the 1990s.
Federal deficits increased in the early 2000s, and went over 10 percent of GDP in the aftermath of the financial crisis of 2008.
In the recovery from the Crash of 2008 deficits slowly reduced to 3 percent of GDP in 2015 and then started increasing again.
In the COVID crisis of 2020 the federal deficit ballooned to over 15 percent of GDP.
Suggested Video: What is the Deficit?
Top Debt Requests:
Find DEFICIT stats and history.
US BUDGET overview and pie chart.
Find NATIONAL DEBT today.
See FEDERAL BUDGET breakdown and estimated vs. actual.
Check STATE debt: CA NY TX FL and compare.
See DEBT ANALYSIS briefing.
See DEBT HISTORY briefing.
Take a COURSE at Spending 101.
Make your own CUSTOM CHART.
Debt Data Sources
Debt data is from official government sources.
- Federal debt data since 1962 comes from the president’s budget.
- Federal debt for 1940-1961 comes from the president’s budget.
- Federal debt for 1914-1939 comes from the
US Treasury
and St. Louis Fed.
- Federal debt before 1914 comes from the
US Treasury
- All other debt data comes from the US Census Bureau.
Gross Domestic Product data comes from US Bureau of Economic Analysis and measuringworth.com.
Detailed table of debt data sources here.
Federal debt data begins in 1792.
State and local debt data begins in 1820.
State and local debt data for individual states begins in 1957.

Gross Federal Debt
| Debt Now: | $39,171,154,946,667.59 | Debt 2/2020: | $23,409,959,150,243.63 |
Site Search
Spending 101
Take a course in government spending:
Spending |
Federal Debt |
Revenue
Defense |
Welfare |
Healthcare |
Education
Debt History |
Entitlements |
Deficits
State Spending |
State Taxes |
State Debt
It’s free!
Win Cash for Bugs
File a valid bug report and get a $5 Amazon Gift Certificate.
Get the Books
 Price: $0.99 Or download for free. |
 From usgovernment spending.com Price: $1.99 |
 Life after liberalism Price: $0.99 Or download for free. |
Data Sources for 2021_2031:
Sources for 2021:
GDP, GO: GDP, GO Sources
Federal: Fed. Budget: Hist. Tables 3.2, 5.1, 7.1
State and Local: State and Local Gov. Finances
'Guesstimated' by projecting the latest change in reported spending forward to future years
Sources for 2031:
GDP, GO: GDP, GO Sources
Federal: Fed. Budget: Hist. Tables 3.2, 5.1, 7.1
State and Local: State and Local Gov. Finances
'Guesstimated' by projecting the latest change in reported spending forward to future years
> data sources for other years
> data update schedule.
Blog
Federal Budget for FY27 Released
On April 4, 2026, we updated usgovernmentspending.com with the numbers from the Public Budget Database in the Budget of the United States Government for Fiscal Year 2027.
Here is how headline budget estimates for the upcoming FY 2027 fiscal year have changed since the release of the FY 2025 budget in Winter 2024. There were no budgetary estimates in the budget documents for the FY 2026 budget.
| $ billion | Estimate for 2027 in FY2025 Budget | Estimate for 2027 in FY2027 Budget | Change |
| Federal Outlays | $7,696.6 | $8,092.9 | +$569.1 |
| Federal Receipts | $6,186.2 | $5,921.0 | +$279.1 |
| Federal Deficit | $1,510.3 | $2,171.9 | +$290.0 |
You can see line item changes from budget to budget here. You can compare budget estimates with actuals here.
Account level spending estimates through FY 2031 come from the Outlays table in the Public Budget Database and were updated on usgovernmentspending.com on April 4, 2026.
Account level budget authority estimates through FY 2031 come from the Budget Authority table in the Public Budget Database and were updated on usgovernmentspending.com on April 4, 2026.
On March 15, 2026 usgovernmentspending.com updated its GDP series with the latest data from the Bureau of Economic Analysis ...
On January 21, 2026 the US Census Bureau released its US national and state population estimates for July 1, 2025. On February 7, 2026 usgovernmentspending.com updated its US and state popula ...
> blog
Budget News
> archive
Spend Links
us numbers • us budget • custom chart • deficit/gdp • spend/gdp • debt/gdp • us gdp • us real gdp • state gdp • breakdown • federal • state • local • 2024 • 2025 • 2026 • california • texas
