
|
US National Inflation Analysis
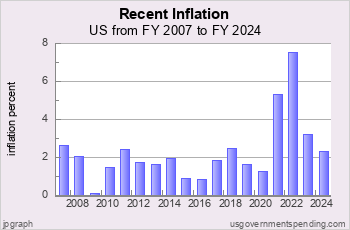
Recent US Inflation by Year
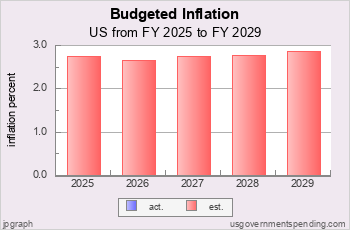
Budgeted US Inflation
US Inflation since 1960
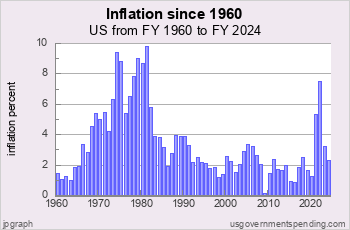
Chart I.03t: US Inflation since 1960
Inflation began the 1960s at a moderate pace, under 1.4 percent. Inflation increased steadily from the mid 1960s passing 2 percent in 1965, 3 percent in 1966 and 5 percent in 1969.
Inflation was held at about 5 percent from 1971 to 1974 due to wage and price controls authorized by the Economic Stabilization Act of 1970. After the Act expired inflation surged, to 8.95 percent in 1974 and 9.25 percent in 1975.
After a brief lull in 1976-77 inflation surged again in the late 1970s breaching 9 percent in 1980 and peaking at 9.7 percent in 1981 in a recession before slowly decreasing in the 1980s, bottoming out at 2.08 percent in 1986 before increasing back to 4 percent in 1989.
In the recession of 1990 inflation began to decline, and since the mid 1990s has fluctuated around 2 percent per year. Until the COVID recovery of 2021 when inflation surged to 4.4 percent.
Recent OMB Inflation Forecasts
Chart I.05: OMB Inflation Forecasts
Every year in the federal budget the Office of Management and Budget publishes "Table 10.1 - Gross Domestic Product and Deflators Used in the Historical Tables" that projects GDP and inflation out five years. In the FY25 budget Table 10.1 (xlsx) provides estimates of GDP and inflation out through FY 2029.
Chart I.05 shows the OMB inflation forecasts for the FY2022, FY2023, FY2024, and FY2025 budgets. The actual historical inflation is shown in yellow. No increase in inflation was forecast until the FY2023 federal budget, and that inflation was expected to be “transitory.”
Suggested Video: What is the Deficit?
Top Debt Requests:
Find DEFICIT stats and history.
US BUDGET overview and pie chart.
Find NATIONAL DEBT today.
See FEDERAL BUDGET breakdown and estimated vs. actual.
Check STATE debt: CA NY TX FL and compare.
See DEBT ANALYSIS briefing.
See DEBT HISTORY briefing.
Take a COURSE at Spending 101.
Make your own CUSTOM CHART.
Debt Data Sources
Debt data is from official government sources.
- Federal debt data since 1962 comes from the president’s budget.
- Federal debt for 1940-1961 comes from the president’s budget.
- Federal debt for 1914-1939 comes from the
US Treasury
and St. Louis Fed.
- Federal debt before 1914 comes from the
US Treasury
- All other debt data comes from the US Census Bureau.
Gross Domestic Product data comes from US Bureau of Economic Analysis and measuringworth.com.
Detailed table of debt data sources here.
Federal debt data begins in 1792.
State and local debt data begins in 1820.
State and local debt data for individual states begins in 1957.

Gross Federal Debt
| Debt Now: | $38,380,536,147,996.03 | Debt 2/2020: | $23,409,959,150,243.63 |
Site Search
Spending 101
Take a course in government spending:
Spending |
Federal Debt |
Revenue
Defense |
Welfare |
Healthcare |
Education
Debt History |
Entitlements |
Deficits
State Spending |
State Taxes |
State Debt
It’s free!
Win Cash for Bugs
File a valid bug report and get a $5 Amazon Gift Certificate.
Get the Books
 Price: $0.99 Or download for free. |
 From usgovernment spending.com Price: $1.99 |
 Life after liberalism Price: $0.99 Or download for free. |
Data Sources for 2021_2029:
Sources for 2021:
GDP, GO: GDP, GO Sources
Federal: Fed. Budget: Hist. Tables 3.2, 5.1, 7.1
State and Local: State and Local Gov. Finances
'Guesstimated' by projecting the latest change in reported spending forward to future years
Sources for 2029:
GDP, GO: GDP, GO Sources
Federal: Fed. Budget: Hist. Tables 3.2, 5.1, 7.1
State and Local: State and Local Gov. Finances
'Guesstimated' by projecting the latest change in reported spending forward to future years
> data sources for other years
> data update schedule.
Blog
Medicaid Update for FY2024
On January 14, 2026, the Centers for Medicare and Medicaid Services (CMS) published its annual report on National Health Expenditures and its NHE Tables includes data on Medicaid from 1960 to 2023. On January 15, 2026, usgovernmentspending.com updated its Medicaid data.
| Item | 2024 Estimate | 2024 Actual |
| Federal Medicaid | $567.2 bn | $567.2 bn |
| State Medicaid (net) | $124.4 bn | $253.2 bn |
| Total Medicaid | $691.6 bn | $820.4 bn |
The federal Medicaid number comes from the Federal Budget Subfunction 558: Grants to states for Medicaid. The state contribution comes from the NHE Tables.
usgovernmentspending.com publishes "guesstimates" of state and local spending from the latest year published by the Census Bureau (currently FY 2023) to the last year in the Historical Tables of the federal budget. (currently 2029 from the FY25 budget). So we have developed "guesstimates" of Medicaid spending going out to 2029, assuming that the overall Medicaid spending increases at the same rate as the federal "Grants to States for Medicaid" increases.
National Health Expenditure data is updated each year in mid December.
On March 27, 2025 the Congressional Budget Office released its annual Long Term Budget Outlook for 2025, which projects federal spendin ...
On November 22, 2025 usgovernmentspending.com updated FY2025 state revenue with quarterly tax data released by the US Ce ...
> blog
Budget News
President’s FY 2025 Budget Release Scheduled for March 11
Although the FY 2024 appropriations process is not yet resolved
Biden to Release Budget March 9
will press McCarthy On Default Risk - Bloomberg
Biden to Release 2023 Budget Request on March 28
how the administration expects to spend money for priorities including aid to Ukraine and the continuing effort to fight the coronavirus pandemic, as well as legislative proposals such as increased funding for community policing programs, cancer research, and mental health education.
> archive
Spend Links
us numbers • us budget • custom chart • deficit/gdp • spend/gdp • debt/gdp • us gdp • us real gdp • state gdp • breakdown • federal • state • local • 2024 • 2025 • 2026 • california • texas
