
|
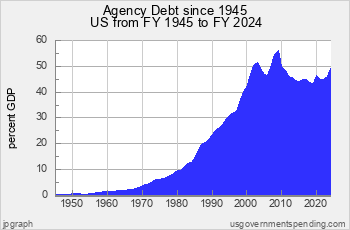
What is Agency Debt?
This page shows Agency Debt.
Agency Debt: That’s the amount of debt outstanding issued by federal agencies (such as FHLB and GNMA) and government-sponsored enterprises (such as Fannie Mae and Freddie Mac).
Up to now, Agency Debt has not been included in the total debt of the United States government as published by the United States Department of the Treasury.
Agency Debt is obtained from the “Financial Accounts of the United States (Z.1)” published by the Federal Reserve Board.
Spending Analyses:
Debt, Deficit Analyses:
Numbers — Charts:
| Tweet | | Contact | Follow @chrischantrill |
Federal Debt Clock
Today the Federal Debt is about $38,380,536,147,996.03.
The amount is the gross outstanding debt issued by the United States Department of the Treasury since 1790 and reported here.
But, it doesn’t include state and local debt.
And, it doesn’t include so-called “agency debt.”
And, it doesn’t include the so-called unfunded liabilities of entitlement programs like Social Security and Medicare.
Federal Debt per person is about $117,623.
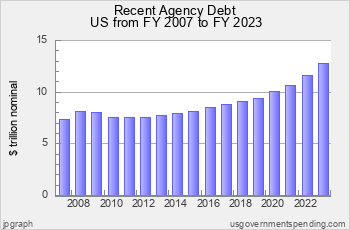
Projected and Recent US Agency Debt Numbers
| Fiscal Year | Total Agency Debt | GSE Debt | Agency/GSE Mortgage Pool Debt |
| 2017 | $8.84 trln | $6.71 trln | $2.13 trln |
| 2018 | $9.09 trln | $6.80 trln | $2.29 trln |
| 2019 | $9.41 trln | $7.00 trln | $2.41 trln |
| 2020 | $10.07 trln | $7.64 trln | $2.43 trln |
| 2021 | $10.68 trln | $8.18 trln | $2.50 trln |
| 2022 | $11.66 trln | $8.97 trln | $2.69 trln |
| 2023 | $11.96 trln | $9.09 trln | $2.87 trln |
| 2024 | $12.25 trln | $9.21 trln | $3.04 trln |
| 2025* | $12.59 trln | $9.32 trln | $3.27 trln |
| 2026* | $12.93 trln | $9.44 trln | $3.50 trln |
Note:
* Agency Debt after 2024 is “guesstimated.”
Agency Debt Charts also: Spending Charts Revenue Charts Debt Charts Deficit Charts
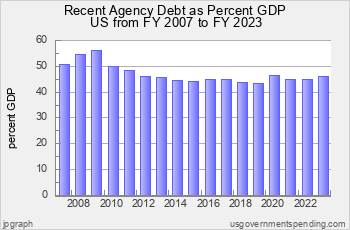
Recent US Agency/GSE Debt
Site Search
Spending 101
Take a course in government spending:
Spending |
Federal Debt |
Revenue
Defense |
Welfare |
Healthcare |
Education
Debt History |
Entitlements |
Deficits
State Spending |
State Taxes |
State Debt
It’s free!
Win Cash for Bugs
File a valid bug report and get a $5 Amazon Gift Certificate.
Gross Federal Debt
| Debt Now: | $38,380,536,147,996.03 | Debt 2/2020: | $23,409,959,150,243.63 |
Data Sources for 2021_2029:
Sources for 2021:
GDP, GO: GDP, GO Sources
Federal: Fed. Budget: Hist. Tables 3.2, 5.1, 7.1
State and Local: State and Local Gov. Finances
'Guesstimated' by projecting the latest change in reported spending forward to future years
Sources for 2029:
GDP, GO: GDP, GO Sources
Federal: Fed. Budget: Hist. Tables 3.2, 5.1, 7.1
State and Local: State and Local Gov. Finances
'Guesstimated' by projecting the latest change in reported spending forward to future years
> data sources for other years
> data update schedule.
Get the Books
 Price: $0.99 Or download for free. |
 From usgovernment spending.com Price: $1.99 |
 Life after liberalism Price: $0.99 Or download for free. |
Medicaid Update for FY2024
On January 14, 2026, the Centers for Medicare and Medicaid Services (CMS) published its annual report on National Health Expenditures and its NHE Tables includes data on Medicaid from 1960 to 2023. On January 15, 2026, usgovernmentspending.com updated its Medicaid data.
| Item | 2024 Estimate | 2024 Actual |
| Federal Medicaid | $567.2 bn | $567.2 bn |
| State Medicaid (net) | $124.4 bn | $253.2 bn |
| Total Medicaid | $691.6 bn | $820.4 bn |
The federal Medicaid number comes from the Federal Budget Subfunction 558: Grants to states for Medicaid. The state contribution comes from the NHE Tables.
usgovernmentspending.com publishes "guesstimates" of state and local spending from the latest year published by the Census Bureau (currently FY 2023) to the last year in the Historical Tables of the federal budget. (currently 2029 from the FY25 budget). So we have developed "guesstimates" of Medicaid spending going out to 2029, assuming that the overall Medicaid spending increases at the same rate as the federal "Grants to States for Medicaid" increases.
National Health Expenditure data is updated each year in mid December.
Blog
Medicaid Update for FY2024
On January 14, 2026, the Centers for Medicare and Medicaid Services (CMS) published its annual report on National Health Expenditures and its NHE Tables includes data on Medicaid from 1960 to 2023. On January 15, 2026, usgovernmentspending.com updated its Medicaid data.
| Item | 2024 Estimate | 2024 Actual |
| Federal Medicaid | $567.2 bn | $567.2 bn |
| State Medicaid (net) | $124.4 bn | $253.2 bn |
| Total Medicaid | $691.6 bn | $820.4 bn |
The federal Medicaid number comes from the Federal Budget Subfunction 558: Grants to states for Medicaid. The state contribution comes from the NHE Tables.
usgovernmentspending.com publishes "guesstimates" of state and local spending from the latest year published by the Census Bureau (currently FY 2023) to the last year in the Historical Tables of the federal budget. (currently 2029 from the FY25 budget). So we have developed "guesstimates" of Medicaid spending going out to 2029, assuming that the overall Medicaid spending increases at the same rate as the federal "Grants to States for Medicaid" increases.
National Health Expenditure data is updated each year in mid December.
On March 27, 2025 the Congressional Budget Office released its annual Long Term Budget Outlook for 2025, which projects federal spendin ...
On November 22, 2025 usgovernmentspending.com updated FY2025 state revenue with quarterly tax data released by the US Ce ...
> blog
