
|
Spending Analyses:
Debt, Deficit Analyses:
Numbers — Charts:
| Tweet | | Contact | Follow @chrischantrill |
Debt and Deficit Facts
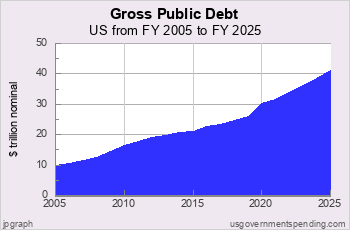
Right now the Gross Federal Debt is $38,380,536,147,996.03.
At the end of
FY 2025 the debt was $37.1 trillion,
or 126.4% GDP.
The previous highest federal debt in US history was 119.0% GDP in 1946 just after World War II.
At the end of
FY 2025 the federal deficit was $1,781 billion,
or 6.1% GDP.
The highest federal deficit in US history was 29.0% GDP in 1943 in World War II.
a usgovernmentdebt.us briefing:

US Government Debt
in Recent Decades
Government debt has been getting bigger.

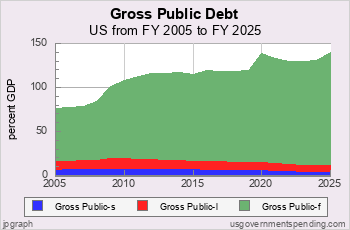
Gross vs. Net Debt
The difference between gross and net is the amount of debt held in federal government trust funds.
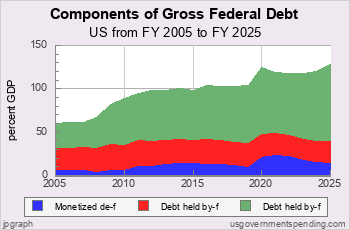
Chart 4.14: Recent Federal Debt by Component
As reported by the federal government in Historical Table 7.1 of the federal budget, the gross debt of the general government is composed of three items: debt held by the Federal Reserve System and therefore monetized, debt owed to government agencies (e.g., Social Security), and debt held by the public, including foreign governments.
In 1990, the Federal Reserve System held debt amounting to 3.9 percent of GDP. Federal debt held by the federal government amounted to 13.3 percent of GDP and debt held by the public amounted to 36.4 percent of GDP.
 - Debt held by public
 - Debt held by federal gov.
 - Debt held by Federal Reserve
Federal debt monetized by the Federal Reserve System increased to over 5 percent of GDP in 1998 and slowly increased, reaching 5.7 percent of GDP before declining in 2008 to 3.4 percent of GDP. In 2009, after the Crash of 2008, the debt held by the Federal Reserve System had increased back to 5.5 percent, and then, following a policy of “quantitative easing” and “zero interest rates,” increased to 14.1 percent of GDP in 2014. It was 16.9 percent GDP at the end of FY 2025.
Federal debt held by the government, principally IOUs to the Social Security system, has climbed steadily, 15 percent of GDP in 1992, and 20 percent in 1999. Debt held by the government exceeded 25 percent of GDP in 2005 and 30 percent of GDP in 2009. Debt held by the government was 24.2 percent of GDP at the end of FY 2025.
Federal debt held by the public (excluding the Federal Reserve System) amounted to 36.4 percent of GDP in 1990. It reached 41 percent of GDP in 1992 and peaked at 42.5 percent of GDP in 1993. Debt held by the public declined to 28.2 percent of GDP by 2000 before settling at about 29 percent of GDP till 2007. with the Crash of 2008 debt held by the public started increasing sharply, reaching 59.7 percent of GDP by 2012, and hit 85.3 percent GDP at the end of FY 2025.

Suggested Video: All About Debt
Top Debt Requests:
Find DEFICIT stats and history.
US BUDGET overview and pie chart.
Find NATIONAL DEBT today.
See FEDERAL BUDGET breakdown and estimated vs. actual.
Check STATE debt: CA NY TX FL and compare.
See DEBT ANALYSIS briefing.
See DEBT HISTORY briefing.
Take a COURSE at Spending 101.
Make your own CUSTOM CHART.
Debt Data Sources
Debt data is from official government sources.
- Federal debt data since 1962 comes from the president’s budget.
- Federal debt for 1940-1961 comes from the president’s budget.
- Federal debt for 1914-1939 comes from the
US Treasury
and St. Louis Fed.
- Federal debt before 1914 comes from the
US Treasury
- All other debt data comes from the US Census Bureau.
Gross Domestic Product data comes from US Bureau of Economic Analysis and measuringworth.com.
Detailed table of debt data sources here.
Federal debt data begins in 1792.
State and local debt data begins in 1820.
State and local debt data for individual states begins in 1957.
Gross Federal Debt
| Debt Now: | $38,380,536,147,996.03 | Debt 2/2020: | $23,409,959,150,243.63 |
Site Search
Spending 101
Take a course in government spending:
Spending |
Federal Debt |
Revenue
Defense |
Welfare |
Healthcare |
Education
Debt History |
Entitlements |
Deficits
State Spending |
State Taxes |
State Debt
It’s free!
Win Cash for Bugs
File a valid bug report and get a $5 Amazon Gift Certificate.
Get the Books
 Price: $0.99 Or download for free. |
 From usgovernment spending.com Price: $1.99 |
 Life after liberalism Price: $0.99 Or download for free. |
Data Sources for 2026:
GDP, GO: GDP, GO Sources
Federal: Fed. Budget: Hist. Tables 3.2, 5.1, 7.1
State and Local: State and Local Gov. Finances
'Guesstimated' by projecting the latest change in reported spending forward to future years
> data sources for other years
> data update schedule.
Blog
Medicaid Update for FY2024
On January 14, 2026, the Centers for Medicare and Medicaid Services (CMS) published its annual report on National Health Expenditures and its NHE Tables includes data on Medicaid from 1960 to 2023. On January 15, 2026, usgovernmentspending.com updated its Medicaid data.
| Item | 2024 Estimate | 2024 Actual |
| Federal Medicaid | $567.2 bn | $567.2 bn |
| State Medicaid (net) | $124.4 bn | $253.2 bn |
| Total Medicaid | $691.6 bn | $820.4 bn |
The federal Medicaid number comes from the Federal Budget Subfunction 558: Grants to states for Medicaid. The state contribution comes from the NHE Tables.
usgovernmentspending.com publishes "guesstimates" of state and local spending from the latest year published by the Census Bureau (currently FY 2023) to the last year in the Historical Tables of the federal budget. (currently 2029 from the FY25 budget). So we have developed "guesstimates" of Medicaid spending going out to 2029, assuming that the overall Medicaid spending increases at the same rate as the federal "Grants to States for Medicaid" increases.
National Health Expenditure data is updated each year in mid December.
On March 27, 2025 the Congressional Budget Office released its annual Long Term Budget Outlook for 2025, which projects federal spendin ...
On November 22, 2025 usgovernmentspending.com updated FY2025 state revenue with quarterly tax data released by the US Ce ...
> blog
Budget News
President’s FY 2025 Budget Release Scheduled for March 11
Although the FY 2024 appropriations process is not yet resolved
Biden to Release Budget March 9
will press McCarthy On Default Risk - Bloomberg
Biden to Release 2023 Budget Request on March 28
how the administration expects to spend money for priorities including aid to Ukraine and the continuing effort to fight the coronavirus pandemic, as well as legislative proposals such as increased funding for community policing programs, cancer research, and mental health education.
> archive
Spend Links
us numbers • us budget • custom chart • deficit/gdp • spend/gdp • debt/gdp • us gdp • us real gdp • state gdp • breakdown • federal • state • local • 2024 • 2025 • 2026 • california • texas
