
|
Spending Analyses:
Debt, Deficit Analyses:
Numbers — Charts:
| Tweet | | Contact | Follow @chrischantrill |

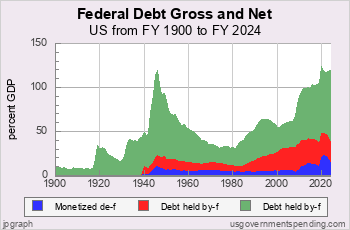
What is the Federal Debt?
Gross Federal Debt: That’s the gross amount of debt outstanding issued by the US Treasury. “Debt held by the public” and “debt held by federal government accounts” here are components of Gross Federal Debt.
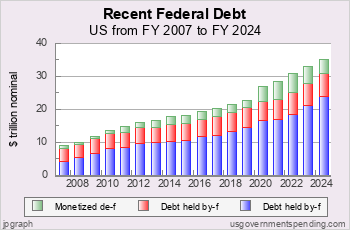
At the end of FY 2025 the federal debt was $37.37 trillion.
At the end of FY 2026 federal debt is “guesstimated” to amount to $39.04 trillion. Thus far, on 2026-06-26, the federal debt is $39.34 trillion. See Coronavirus Update page.
Here is the gross federal debt by year for the last decade:
| ||||||||||||||||||||||||||||||||||||
Click for federal debt from 1960 to present.
Also, see
National Debt,
State Debt,
Local Debt,
Agency Debt, and
Federal Deficit.
Federal Debt Clock
Today the Federal Debt is about $39,337,503,706,976.53.
The amount is the gross outstanding debt issued by the United States Department of the Treasury since 1790 and reported here.
But, it doesn’t include state and local debt.
And, it doesn’t include so-called “agency debt.”
And, it doesn’t include the so-called unfunded liabilities of entitlement programs like Social Security and Medicare.
Federal Debt per person is about $120,556.
Federal Debt Analysis
Recent US Federal Debt

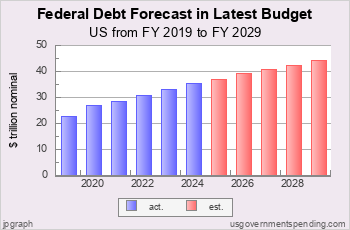

Recent OMB Federal Debt Forecasts
Chart D.19f: OMB Federal Debt Forecasts
Every year in the federal budget the Office of Management and Budget publishes "Table 7.1 - Federal Debt at the End of Year" that projects federal debt out five years. In the FY27 budget Table 7.1 (xlsx) provides estimates of federal debt out through FY 2031.
Chart D.18f shows the OMB federal debt forecasts for the FY2024, FY2025, FY2026, and FY2027 budgets. The actual historical federal debt up to end-of-year for FY2025 is shown in yellow.
Suggested Video: All About Debt
Top Debt Requests:
Find DEFICIT stats and history.
US BUDGET overview and pie chart.
Find NATIONAL DEBT today.
See FEDERAL BUDGET breakdown and estimated vs. actual.
Check STATE debt: CA NY TX FL and compare.
See DEBT ANALYSIS briefing.
See DEBT HISTORY briefing.
Take a COURSE at Spending 101.
Make your own CUSTOM CHART.
Debt Data Sources
Debt data is from official government sources.
- Federal debt data since 1962 comes from the president’s budget.
- Federal debt for 1940-1961 comes from the president’s budget.
- Federal debt for 1914-1939 comes from the
US Treasury
and St. Louis Fed.
- Federal debt before 1914 comes from the
US Treasury
- All other debt data comes from the US Census Bureau.
Gross Domestic Product data comes from US Bureau of Economic Analysis and measuringworth.com.
Detailed table of debt data sources here.
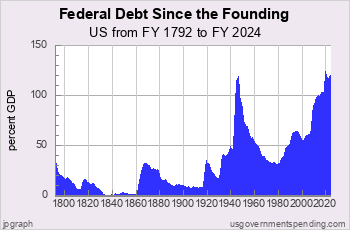
Federal debt data begins in 1792.
State and local debt data begins in 1820.
State and local debt data for individual states begins in 1957.
Gross Federal Debt
| Debt Now: | $39,337,503,706,976.53 | Debt 2/2020: | $23,409,959,150,243.63 |
Site Search
Spending 101
Take a course in government spending:
Spending |
Federal Debt |
Revenue
Defense |
Welfare |
Healthcare |
Education
Debt History |
Entitlements |
Deficits
State Spending |
State Taxes |
State Debt
It’s free!
Win Cash for Bugs
File a valid bug report and get a $5 Amazon Gift Certificate.
Get the Books
 Price: $0.99 Or download for free. |
 From usgovernment spending.com Price: $1.99 |
 Life after liberalism Price: $0.99 Or download for free. |
Data Sources for 2021_2031:
Sources for 2021:
GDP, GO: GDP, GO Sources
Federal: Fed. Budget: Hist. Tables 3.2, 5.1, 7.1
State and Local: State and Local Gov. Finances
'Guesstimated' by projecting the latest change in reported spending forward to future years
Sources for 2031:
GDP, GO: GDP, GO Sources
Federal: Fed. Budget: Hist. Tables 3.2, 5.1, 7.1
State and Local: State and Local Gov. Finances
'Guesstimated' by projecting the latest change in reported spending forward to future years
> data sources for other years
> data update schedule.
Blog
Medicare/Social Security 2026 Trustees Report Released
On June 16, 2026, the Center for Medicare Services released its annual Medicare Trustees Report, which projects Medicare spending out to 2095. As in the past, the report shows that federal health-care programs will eat the budget.
In this report the Trustees forecast that Medicare will top out at a little above 6 percent of GDP in the 2080s.
On June 15, 2026, usgovernmentspending.com updated its chart of the Medicare Outlook here based on data in the 2026 Medicare Trustees Report. You can download the data and also view selected Medicare Trustee forecasts going back to 2005.
In June 2026, the Social Security Administration released its annual OASDI Trustees Report, which projects Social Security spending out to 2095. As in the past, the report shows that Social Security spending will max out at about 6 percent of GDP. UsGovernmentspending.com uses the Supplemental Single Year Tables.
On June 15, 2026, usgovernmentspending.com updated its chart of the Social Security Outlook here based on data in the 2026 OASDI Trustees Report. You can download the data and also view selected OASDI Trustee forecasts going back to 1997.
On February 25, 2026 the Congressional Budget Office released its annual Long Term Budget Outlook for 2026, which projects ...
The US Bureau of Economic Analysis (BEA) released its Gross State Product (GSP) data for 2025 on April 9, 2026.Usgovernment ...
> blog
Budget News
President’s FY 2025 Budget Release Scheduled for March 11
Although the FY 2024 appropriations process is not yet resolved
Biden to Release Budget March 9
will press McCarthy On Default Risk - Bloomberg
Biden to Release 2023 Budget Request on March 28
how the administration expects to spend money for priorities including aid to Ukraine and the continuing effort to fight the coronavirus pandemic, as well as legislative proposals such as increased funding for community policing programs, cancer research, and mental health education.
> archive
Spend Links
us numbers • us budget • custom chart • deficit/gdp • spend/gdp • debt/gdp • us gdp • us real gdp • state gdp • breakdown • federal • state • local • 2024 • 2025 • 2026 • california • texas
