
|
Spending Analyses:
Debt, Deficit Analyses:
Numbers — Charts:
| Tweet | | Contact | Follow @chrischantrill |
United States Debt Clock
Headline federal, state, local, and total US government debt.
| ||||||||||||||||||||||||||||||||||||||||||||||||||||||
US Agency Debt is debt issued by federal agencies but not included in Gross Federal Debt.
Federal Debt Clock
Today the Federal Debt is about $39,221,984,586,285.30.
The amount is the gross outstanding debt issued by the United States Department of the Treasury since 1790 and reported here.
But, it doesn’t include state and local debt.
And, it doesn’t include so-called “agency debt.”
And, it doesn’t include the so-called unfunded liabilities of entitlement programs like Social Security and Medicare.
Federal Debt per person is about $120,202.
Total US Government Debt in 2026
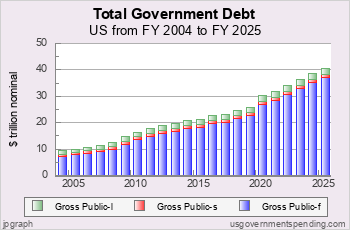
Chart C.01t: Recent US Government Debt
At the end of FY 2026 the total government debt in the United States, including federal, state, and local, is expected to be $42.8 trillion.
Get more information about Total Debt here.
Total Federal Government Debt in 2026
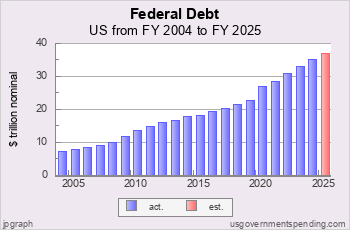
Chart C.01f: Recent US Federal Debt
At the end of FY 2026 the gross US federal government debt is estimated to be $39.04 trillion, according to the FY27 Federal Budget. Of this gross amount, debt “Held by the Public: Other” is estimated by usgovernmentspending.com at $27.28 trillion, debt “Held by the Public: Federal Reserve System” (i.e. monetized debt) is estimated by usgovernmentspending.com at $4.36 trillion and debt “Held by Federal Government Accounts” is estimated at $7.40 trillion.
Here is the gross federal debt by year for the last decade:
| |||||||||||||||||||||||||||||||||||
Click for federal debt from 1960 to present.
Get more information about Federal Debt here.
Total Federal Agency Debt in 2026
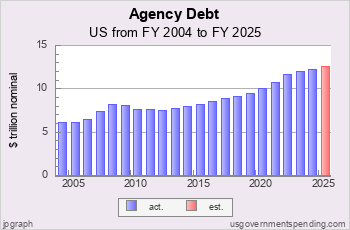
Chart C.01a: Recent Federal Agency Debt
At the end of FY 2026 the federal agency debt in the United States is “guesstimated” to be $12.89 trillion.
Agency debt is debt issued by federal agencies and government-sponsored enterprises, and is not included in the total gross debt of the federal government.
Get more information about Agency Debt here.
Total State Government Debt in 2026
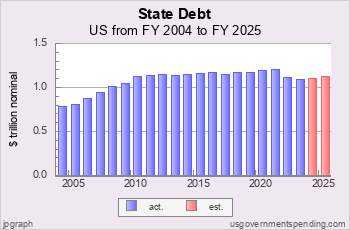
Chart C.01s: Recent State Government Debt
At the end of FY 2026 the state government debt in the United States is expected to be $1.19 trillion.
Get more information about State Government Debt here.
Total Local Government Debt in 2026
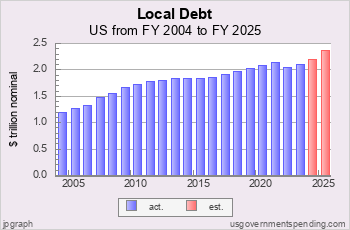
Chart C.01l: Recent Local Government Debt
At the end of FY 2026 the local government debt in the United States is expected to be $2.57 trillion.
Get more information about Local Government Debt here.
Suggested Video: All About Debt
Top Debt Requests:
Find DEFICIT stats and history.
US BUDGET overview and pie chart.
Find NATIONAL DEBT today.
See FEDERAL BUDGET breakdown and estimated vs. actual.
Check STATE debt: CA NY TX FL and compare.
See DEBT ANALYSIS briefing.
See DEBT HISTORY briefing.
Take a COURSE at Spending 101.
Make your own CUSTOM CHART.
Debt Data Sources
Debt data is from official government sources.
- Federal debt data since 1962 comes from the president’s budget.
- Federal debt for 1940-1961 comes from the president’s budget.
- Federal debt for 1914-1939 comes from the
US Treasury
and St. Louis Fed.
- Federal debt before 1914 comes from the
US Treasury
- All other debt data comes from the US Census Bureau.
Gross Domestic Product data comes from US Bureau of Economic Analysis and measuringworth.com.
Detailed table of debt data sources here.
Federal debt data begins in 1792.
State and local debt data begins in 1820.
State and local debt data for individual states begins in 1957.
Site Search
Spending 101
Take a course in government spending:
Spending |
Federal Debt |
Revenue
Defense |
Welfare |
Healthcare |
Education
Debt History |
Entitlements |
Deficits
State Spending |
State Taxes |
State Debt
It’s free!
Win Cash for Bugs
File a valid bug report and get a $5 Amazon Gift Certificate.
Gross Federal Debt
| Debt Now: | $39,221,984,586,285.30 | Debt 2/2020: | $23,409,959,150,243.63 |
Data Sources for 2026:
GDP, GO: GDP, GO Sources
Federal: Fed. Budget: Hist. Tables 3.2, 5.1, 7.1
State and Local: State and Local Gov. Finances
'Guesstimated' by projecting the latest change in reported spending forward to future years
> data sources for other years
> data update schedule.
Get the Books
 Price: $0.99 Or download for free. |
 From usgovernment spending.com Price: $1.99 |
 Life after liberalism Price: $0.99 Or download for free. |
Federal Budget for FY27 Released
On April 4, 2026, we updated usgovernmentspending.com with the numbers from the Public Budget Database in the Budget of the United States Government for Fiscal Year 2027.
Here is how headline budget estimates for the upcoming FY 2027 fiscal year have changed since the release of the FY 2025 budget in Winter 2024. There were no budgetary estimates in the budget documents for the FY 2026 budget.
| $ billion | Estimate for 2027 in FY2025 Budget | Estimate for 2027 in FY2027 Budget | Change |
| Federal Outlays | $7,696.6 | $8,092.9 | +$569.1 |
| Federal Receipts | $6,186.2 | $5,921.0 | +$279.1 |
| Federal Deficit | $1,510.3 | $2,171.9 | +$290.0 |
You can see line item changes from budget to budget here. You can compare budget estimates with actuals here.
Account level spending estimates through FY 2031 come from the Outlays table in the Public Budget Database and were updated on usgovernmentspending.com on April 4, 2026.
Account level budget authority estimates through FY 2031 come from the Budget Authority table in the Public Budget Database and were updated on usgovernmentspending.com on April 4, 2026.
Blog
Federal Budget for FY27 Released
On April 4, 2026, we updated usgovernmentspending.com with the numbers from the Public Budget Database in the Budget of the United States Government for Fiscal Year 2027.
Here is how headline budget estimates for the upcoming FY 2027 fiscal year have changed since the release of the FY 2025 budget in Winter 2024. There were no budgetary estimates in the budget documents for the FY 2026 budget.
| $ billion | Estimate for 2027 in FY2025 Budget | Estimate for 2027 in FY2027 Budget | Change |
| Federal Outlays | $7,696.6 | $8,092.9 | +$569.1 |
| Federal Receipts | $6,186.2 | $5,921.0 | +$279.1 |
| Federal Deficit | $1,510.3 | $2,171.9 | +$290.0 |
You can see line item changes from budget to budget here. You can compare budget estimates with actuals here.
Account level spending estimates through FY 2031 come from the Outlays table in the Public Budget Database and were updated on usgovernmentspending.com on April 4, 2026.
Account level budget authority estimates through FY 2031 come from the Budget Authority table in the Public Budget Database and were updated on usgovernmentspending.com on April 4, 2026.
On March 15, 2026 usgovernmentspending.com updated its GDP series with the latest data from the Bureau of Economic Analysis ...
On January 21, 2026 the US Census Bureau released its US national and state population estimates for July 1, 2025. On February 7, 2026 usgovernmentspending.com updated its US and state popula ...
> blog
