
|
Numbers — Charts:
History:
Analyses:
| Tweet | | Contact | Follow @chrischantrill |
What is the Total US Defense Spending?
In FY 2026, total US government spending for defense (including military defense, veterans affairs, and foreign policy) is budgeted to be $1,467.5 billion. Military spending is budgeted at $966.4 billion, Veterans spending is budgeted at $441.4 billion, and foreign policy and foreign aid spending is budgeted at $59.7 billion.
Current US Defense Spending
| Fiscal Year | Military Spending | Veterans | Foreign Aid | Total Defense |
| 2024 | $873.5 billion | $327.0 billion | $56.4 billion | $1,257.0 billion |
| 2025 | $916.1 billion | $378.5 billion | $45.2 billion | $1,339.8 billion |
| 2026 | $966.4 billion | $441.4 billion | $59.7 billion | $1,467.5 billion |
| 2027 | $1,205.0 billion | $476.7 billion | $62.6 billion | $1,744.3 billion |
Military Spending is spending by the Department of Defense. Foreign Aid includes both military aid and other foreign aid.
a usgovernmentspending.com briefing:

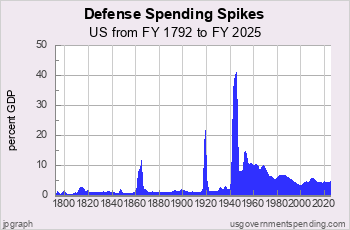
US Defense Spending History
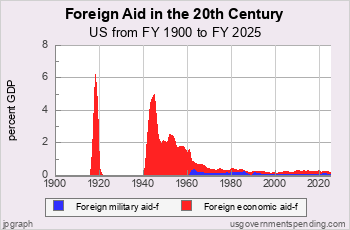
In peace time, the US government used to spend very little on defense, about one percent of GDP.
But that changed after World War II when the United States found itself in a
global contest against Communism.
Ever since, defense spending has never been less than 3.6 percent of GDP. In wartime, of course, the United States spends as much as it can command. In World War II
defense spending exceeded 41 percent of GDP in 1945.

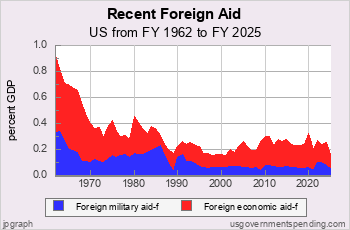
Recent Defense Spending
Defense spending declined in the 1990s after the end of the Cold War and increased in the 2000s during the War on Terror.
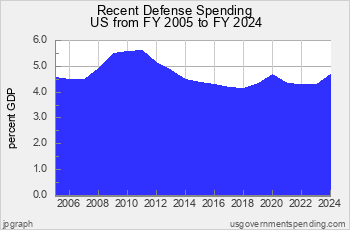
Chart 2.32: Recent Defense Spending
Defense spending stood at 6.8 percent of GDP at the height of the Reagan defense buildup. But, beginning even before the breakup of the Soviet Union it began a decline, reaching below 6 percent in 1990, below 4 percent in 1996 and bottoming out at 3.5 percent of GDP in 2001, about half the level of 1985.
But 9/11, the terrorist attack on iconic US buildings in 2001, changed that, and defense spending began a substantial increase in two stages. First, it increased to 4.6 percent by 2005 for the invasion of Iraq, and then to 5.0 percent in 2008 for the the “surge” in Iraq.
Spending increased further to 5.7 percent in 2011 with the stepped up effort in Afghanistan. Defense spending declined to 4.2 percent of GDP in 2018.
In FY2025 defense spending was 4.4 percent GDP.
See also Defense Spending Analysis.


Suggested Video: US Defense Spending
Top Spending Requests:
Find DEFICIT stats and history.
Get WELFARE stats and history.
US BUDGET overview and pie chart.
Find NATIONAL DEBT today.
DOWNLOAD spending data or debt data.
See FEDERAL BUDGET breakdown and estimated vs. actual.
MILITARY SPENDING details, budget and history.
ENTITLEMENT SPENDING history.
See BAR CHARTS of spending, debt.
Check STATE spending: CA NY TX FL and compare.
See SPENDING ANALYSIS briefing.
See SPENDING HISTORY briefing.
Take a COURSE at Spending 101.
Make your own CUSTOM CHART.
Spending Data Sources
Spending data is from official government sources.
- Federal spending data since 1962 comes from the president’s budget.
- All other spending data comes from the US Census Bureau.
Gross Domestic Product data comes from US Bureau of Economic Analysis and measuringworth.com.
Detailed table of spending data sources here.
Medicare breakdown here; Medicaid breakdown here.
Federal spending data begins in 1792.
State and local spending data begins in 1820.
State and local spending data for individual states begins in 1957.
Gross Federal Debt
| Debt Now: | $39,414,179,016,130.09 | Debt 2/2020: | $23,409,959,150,243.63 |
Site Search
Spending 101
Take a course in government spending:
Spending |
Federal Debt |
Revenue
Defense |
Welfare |
Healthcare |
Education
Debt History |
Entitlements |
Deficits
State Spending |
State Taxes |
State Debt
It’s free!
Win Cash for Bugs
File a valid bug report and get a $5 Amazon Gift Certificate.
Get the Books
 Price: $0.99 Or download for free. |
 From usgovernment spending.com Price: $1.99 |
 Life after liberalism Price: $0.99 Or download for free. |
Blog
State and Local Finances for 2024 -- First Look
On July 2, 2026 we updated the state and local spending and revenue for FY 2024 using the new Census Bureau State and Local Government Finances "first look"summaries for FY 2024 released in April 2026. (See also Annual Survey of State and Local Government Finances). The release includes state and local spending for the United States as a whole. It does not include the 50 individual states and the District of Columbia.
State and local spending and revenue for FY2024 are now actual historical spending as reported by the Census Bureau.
We have updated the "guesstimated" state and local finances for FY2025-31 as indicated in our "guesstimate" blog entries.
Beginning in 2021, the Census Bureau stopped splitting "Public welfare" into three parts:
- Cash assistance payments
- Vendor payments
- Other public welfare
On June 16, 2026, the Center for Medicare Services released its annual ...
On February 25, 2026 the Congressional Budget Office released its annual Long Term Budget Outlook for 2026, which projects ...
> blog
Budget News
President’s FY 2025 Budget Release Scheduled for March 11
Although the FY 2024 appropriations process is not yet resolved
Biden to Release Budget March 9
will press McCarthy On Default Risk - Bloomberg
Biden to Release 2023 Budget Request on March 28
how the administration expects to spend money for priorities including aid to Ukraine and the continuing effort to fight the coronavirus pandemic, as well as legislative proposals such as increased funding for community policing programs, cancer research, and mental health education.
> archive
Spend Links
us numbers • us budget • custom chart • deficit/gdp • spend/gdp • debt/gdp • us gdp • us real gdp • state gdp • breakdown • federal • state • local • 2024 • 2025 • 2026 • california • texas
